Creative Coding
Develop applications and games using programming and scripting languages such as Java, C++, C#, Swift and JavaScript for platforms including Processing, Node.js, OpenCV and Unity.
- Useful learning resources
- Tutorials
- "Hello, World!" in Node.js
- Web App Template for Beginners
- How to fix "Internal data stream error" in Processing 4
- Command Line Tools & Utilities
- Making a website for your HTML, JS, CSS or p5.js files
- How to export your p5.js as a video
- Workshop: Introduction to Creative Coding
- Week 1 - Coordinates, shapes and colour
- Week 2 - Animation, conditionals & random numbers
- Week 3 - Iteration, arrays, objects and pixel arrays
- Week 4 - Other inputs and APIs
- Other workshops
- Concepts
Useful learning resources
Books
- HTML & CSS
- HTML & CSS Book - A book aimed at designers introducing concepts within web development
- JavaScript
- JavaScript: The Good Parts by Douglas Crockford
- p5.js
- Processing
- Learning Processing by Daniel Shiffman
- Nature of Codeby Daniel Shiffman
Websites
- JavaScript
- JavaScript Syntax Basics - This is a great cheatsheet for understanding the basics of the JavaScript language/syntax. A lot of concepts here are also applicable knowledge in a variety of other programming languages.
- Khan Academy Programming courses - Free online video courses with interactive code editor
- Lynda.com - Foundations of Programming Fundamentals
- Learn JS - Introduces some basics of JavaScript using an interactive browser-based prompt
- Praxent - Resource roundup with helpful articles on beginner coding. (Thank you Emma!)
- P5.js
-
Daniel Shiffman has a vast collection of videos introducing programming using p5.js. Take a look through these videos if you are interested in getting a head start:
https://vimeo.com/channels/learningp5js -
Kadenze is an online platform for creative education. You can take structured courses with plenty of video based content and exercises. Here is an Introduction to Programming for the Visual Arts with P5:
https://www.kadenze.com/courses/introduction-to-programming-for-the-visual-arts-with-p5-js/info
- Programming Design Systems / Printing Code
- A course that intersects graphic design and programming run by Rune Madesen at ITP in New York: http://printingcode.runemadsen.com/
- [Video] Printing Code: Programming and the Visual Arts, Rune Madsen https://vimeo.com/61113159
- Soon to be an online book with tutorials: https://programmingdesignsystems.com/
- HTML & CSS
- https://www.codecademy.com/learn/learn-html-css
- Open CV
- https://vimeo.com/69907695
- Code
- https://github.com/atduskgreg/opencv-processing
- https://github.com/shiffman/Face-It
- Topics
- Face detection
- Which Face
- Edge detection
- Pattern matching
- Background Subtraction
- Data Vis
Videos
Tutorials
"Hello, World!" in Node.js
Introduction
The first program most people write when learning a new programming language is one form or another of the infamous "Hello, World!".
Preparation
What you'll need to know
To follow this tutorial you should be familiar with the basics of the command-line (also known as Terminal on OS X or Command Prompt on Windows). Below are some resources that will help you get up to speed on this topic:
-
Code Academy short course - Code Academy provide a short course on command line. It has an interactive prompt in the browser so you can get to grips with the syntax before diving into the CLI.
-
An introduction to Unix and Shell - The Interactive Telecommunications Program at NYU has a very interesting introduction to Unix, which is the precursor and model for Android, Apple iOS, Raspbian (Raspberry Pi), Linux and OSx operating systems. It is also a good overview of the history, philosophy and the anatomy of the shell.
Install NodeJS
You will need to download and install NodeJS. Download the installer for your particular operating system (OSX, Windows or Linux) from the NodeJS website and follow the instructions.
To test if NodeJS has been installed successfully:
- Open a command line prompt (Terminal or Command Prompt)
- And type the following:
$ node -v
Do not type the `$`. This just tells you that everything following the dollar is a single line in the command line prompt.
You should see the version of NodeJS that you installed. Something like: v4.4.7. If you see an error then you may need to downloading and installing again.
Install other software (optional)
We recommend installing and using Atom text editor, because it is free, cross-platform and good for beginners to advanced programmers.
You will be editing JavaScript files throughout this tutorial, which can be done with almost *any* simple text editor you happen to have on your computer. This excludes Microsoft's Word, Apple's Pages or other word processing software, which don't count as simple and will add other unseen characters to your file.
Tutorial
To create and execute our first NodeJS application we simply (1) create a text file with the .js suffix, (2) edit the file and add some JavaScript and (3) pass this file to NodeJS using the command-line prompt.
(1) Create a directory and file
Our goal is to create a directory called hello-world and within it a file called hello.js. You can create a directory and a file using many methods but below are the instructions and an animation of how this is done using the command line.
$ cd Desktop
$ mkdir hello-world
$ cd hello-world
$ touch hello.js
The commands above explained:
-
cd [directory-name]- Change the current directory you are in -
mkdir [directory-name]- Make a new directory in your current location -
touch [file-name]- Create an empty file

The result of this should be a directory and file on your desktop in this structure:
Desktop/
   └── hello-world/
      └── hello.js
(2) Edit file and add JavaScript
- Open the file
hello.jsin your preferred text editor - Add the following code to the top of the file and save:
console.log("Hello, world of NodeJS!");
(3) Execute our hello.js script using NodeJS
- Open a command-line prompt
- Change directory so that you are inside
Desktop/hello-world/
$ cd ~/Desktop/hello-world
TIP: When changing directory with the `cd` command (or using any command for that matter) you can use the tilde (`~`) to navigate to your home directory. e.g. `cd ~/Desktop`
- Pass your `hello.js` script to the `node` command ``` $ node hello.js ``` You should see the "Hello, world of NodeJS!" message printed out into your CLI prompt.Below is an animation of this step.

Web App Template for Beginners
Start with this one. Learn to build a local web app that you can modify in your future projects.
Background
Each web app has a frontend and backend. Frontend is usually for UI and design and runs on browser, on user’s own computer. P5.js sketches are frontend.
Backend is behind-the-scenes code that runs on server. It is stores and organizes data and delivers your app to users, ie. clients. If 10 people access your website, there are 10 frontends in action but only 1 backend.
Backend is often built with Node.js or Python. Here we use Node.js.
Setup
1)
2)
3)
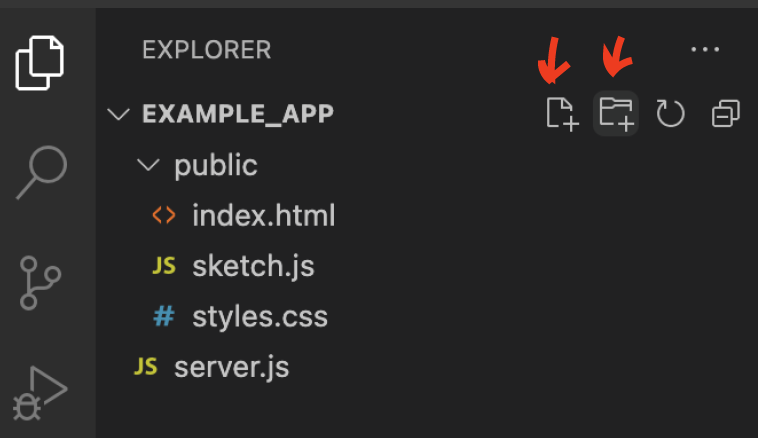
So there are three empty files in “public” subfolder and an empty server.js outside that in the root folder.
Alternatively you can create the setup outside your code editor, however Visual Code has made it really easy to create code files from the scratch so that’s why I recommend it.
Server with Node and Express
4)
5)
6)
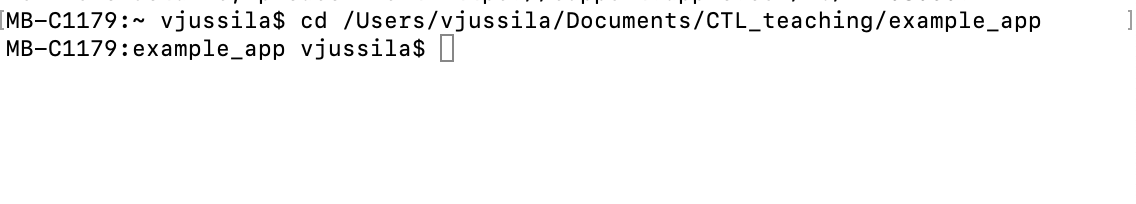
On command line, type cd. Then in Finder, select "example_app" folder and drag it to command line. It gives you the path to that folder automatically. Press enter.
Now you are operating inside that folder using command line. It should look like this:
7)npm init. Answer the questions by typing to the command line and pressing enter after each question. This creates a package.json file that makes the project easier for others to manage and install. If confused, check the tutorial on step 5.
When done, type npm install express. This installs Express to this project folder (we only want it to live in this folder, not everywhere on your computer).
8)server.js file. Add the following code:
const express = require("express");
const app = express();
const server = app.listen(3000);
app.use(express.static("public"));
console.log("It works");
Here we are telling the backend to:
-Use Express framework
-Set our server to local port 3000
-Serve files that are in the folder called "public"
-Print "It works" when the server is running
9)node server.js on command line and press enter. This is how you tell Node to run a file called server.js. It should print "It works" on the command line.
10)
Now you should have a basic server running! But we don’t have anything that the server could show. We’ll fix it next.
HTML setup
11)
<!DOCTYPE html>
<html>
   <head>
      <meta charset="utf-8" />
      <title>My test project</title>
   </head>
   <body>
      <h1>My first title!</h1>
   </body>
</html>
12)
If you get any errors, check your server.js and index.html files again. It's very easy to make a spelling mistake!
Client Javascript setup
13)
In your html file, add the following line of code in the <head> section of your html, after the <title> line:
<script src="https://cdn.jsdelivr.net/npm/p5@1.4.0/lib/p5.js"></script>
So the section now looks like:
<head>
  <meta charset="utf-8" />
  <title>My test project</title>
  <script src="https://cdn.jsdelivr.net/npm/p5@1.4.0/lib/p5.js">  </script>
</head>
This line of code gives us access to p5.js library in our project. Note that you can add other Javascript libraries in a similar fashion, like ML5 for machine learning or Three.js for building 3D visuals.
14)sketch.js file. First we need to reference that file in out HTML so that there is a connection. You can think about this way: HTML file is like the frame of a painting, and JS is what happens on the canvas of the painting. We need both!
In index.html, add the following line to the <body> section:
<script src="sketch.js"></script>
So that it looks like:
<body>
  <h1>My first title!</h1>
  <script src="sketch.js"></script>
</body>
15)sketch.js, paste the following code:
function setup() {
  createCanvas(400, 400);
}

function draw() {
  background(100);
  rectMode(CENTER);
  strokeWeight(3);
  stroke(255, 0, 0);
  fill(255, 192, 203);
  rect(100, 100, 200, 200);
}
Here, we are first drawing a grey background of 400 x 400 pixels. Then we add a pink rectangle with red outline to the center of the canvas. For more p5.js help, see their reference.
16)
Note
This is a local server and local project. Currently it only lives on your computer. In order to make a public web app that anyone can access, you need to deploy it. There will be a tutorial for this later. :)
Next
Try to add a paragraph of text to your page. Guide
Try to add an image to your page. Guide
Try to change the color of the rectangle with a mouse click. Guide
How to fix "Internal data stream error" in Processing 4
Error
In Processing 4, you will see this error often BaseSrc: [avfvideosrc0] : Internal data stream error when using the video library with cameras and a MAC. To see more about the capture function, please see here.
How to fix (12/2024)
Change this line cam = new Capture(this, cameras[0]);
to "pipeline:avfvideosrc device-index=0"
Full Code
import processing.video.*;

Capture cam;

void setup() {
  size(640, 480);

  String[] cameras = Capture.list();

  if (cameras.length == 0) {
    println("There are no cameras available for capture.");
    exit();
  } else {
    println("Available cameras:");
    for (int i = 0; i < cameras.length; i++) {
      println(cameras[i]);
    }

    // The camera can be initialized directly using an
    // element from the array returned by list():
    cam = new Capture(this, width, height, "pipeline:avfvideosrc device-index=0", 30);
    cam.start();
  }
}

void draw() {
  if (cam.available() == true) {
    cam.read();
  }
  image(cam, 0, 0);
  // The following does the same, and is faster when just drawing the image
  // without any additional resizing, transformations, or tint.
  //set(0, 0, cam);
}
Command Line Tools & Utilities
A Command Line Interface is a way of interacting with a computer by issuing commands in the form of lines of text. These commands interface with your operating system and hardware to perform complex and intensive operations.
There is a large amount of useful Free and Open Source Software (FOSS) available online that does not need or use a Graphical User Interface (GUI). Often this software works more efficiently with the operating system or directly with the hardware and therefore can perform tasks such as image, video or sound manipulation with ease.
Also because the CLI has a scripting language you can write scripts that automates certain tasks. For example:
- Downloading/uploading files from servers or web pages
- Converting, cropping, trimming, splitting, combining video files
- Converting, cropping, combining image files
- Adding effects to, combining, trimming, splitting audio files
- Mixing video & audio
- Extracting video & audio
- Adding text to video or images
Installing CLI Tools
Homebrew - Package Manager for macOS
Homebrew is a package manager for the macOS CLI. Once you install it on the CLI you can with one line install a lot of software from it's repository.
-
Open Terminal
-
Copy and paste the following line:
/usr/bin/ruby -e "$(curl -fsSL https://raw.githubusercontent.com/Homebrew/install/master/install)"
- Hit enter and it will install it for you.
- To test if it was successful enter the following command:
brew -v
FFMPEG
FFMPEG is a powerful and flexible tool for performing any transformation tasks on video files.
Install
brew install ffmpeg \
    --with-tools \
    --with-fdk-aac \
    --with-freetype \
    --with-fontconfig \
    --with-libass \
    --with-libvorbis \
    --with-libvpx \
    --with-opus \
    --with-x265
Example use / Tutorial
SoX
The homepage for SoX calls it "the Swiss Army knife of sound processing programs" and gives the following description:
SoX is a cross-platform (Windows, Linux, MacOS X, etc.) command line utility that can convert various formats of computer audio files in to other formats. It can also apply various effects to these sound files, and, as an added bonus, SoX can play and record audio files on most platforms.
Install
brew install sox
Example use / Tutorials
- Good introduction and some examples - http://www.krisyu.org/blog/processing-audio-files-sox.html
ImageMagick
ImageMagick is a powerful image manipulation tool.
Install
brew install imagemagick
Example use
- A comprehensive list of example use - http://www.imagemagick.org/Usage/
Making a website for your HTML, JS, CSS or p5.js files
We are going to make a website using something called GitHub pages to make a website. Signing up for a GitHub account and subsequently creating a GitHub pages URL will allow you to upload your HTML, JS & CSS files online, so that you can access your website from anywhere.
Bit of background (Feel free to skip)
GitHub is a website that stores what are called repositories. Repositories contain code, very much just like a folder on your computer. Git is what is called a version control system and to us what it means is that when you save files and commit them it will also save the previous version of your files too. This is very popular with a lot of people in the world of tech, because if something goes wrong, you can always go back to when it did work!
Step 1: Signing up for GitHub
Go to https://github.com and sign up for an account, the form should be on the homepage. There will be a few extra forms when you signup, you can skip through these.
Very important!!!1!!1!
The way that GitHub pages work is that in the end, your website will have the name of your username in it (
Step 2: Creating a repository
Now we have to create a repository. On the left hand side there should be a link that says Create a repository. Click this link and it should take you to this page:
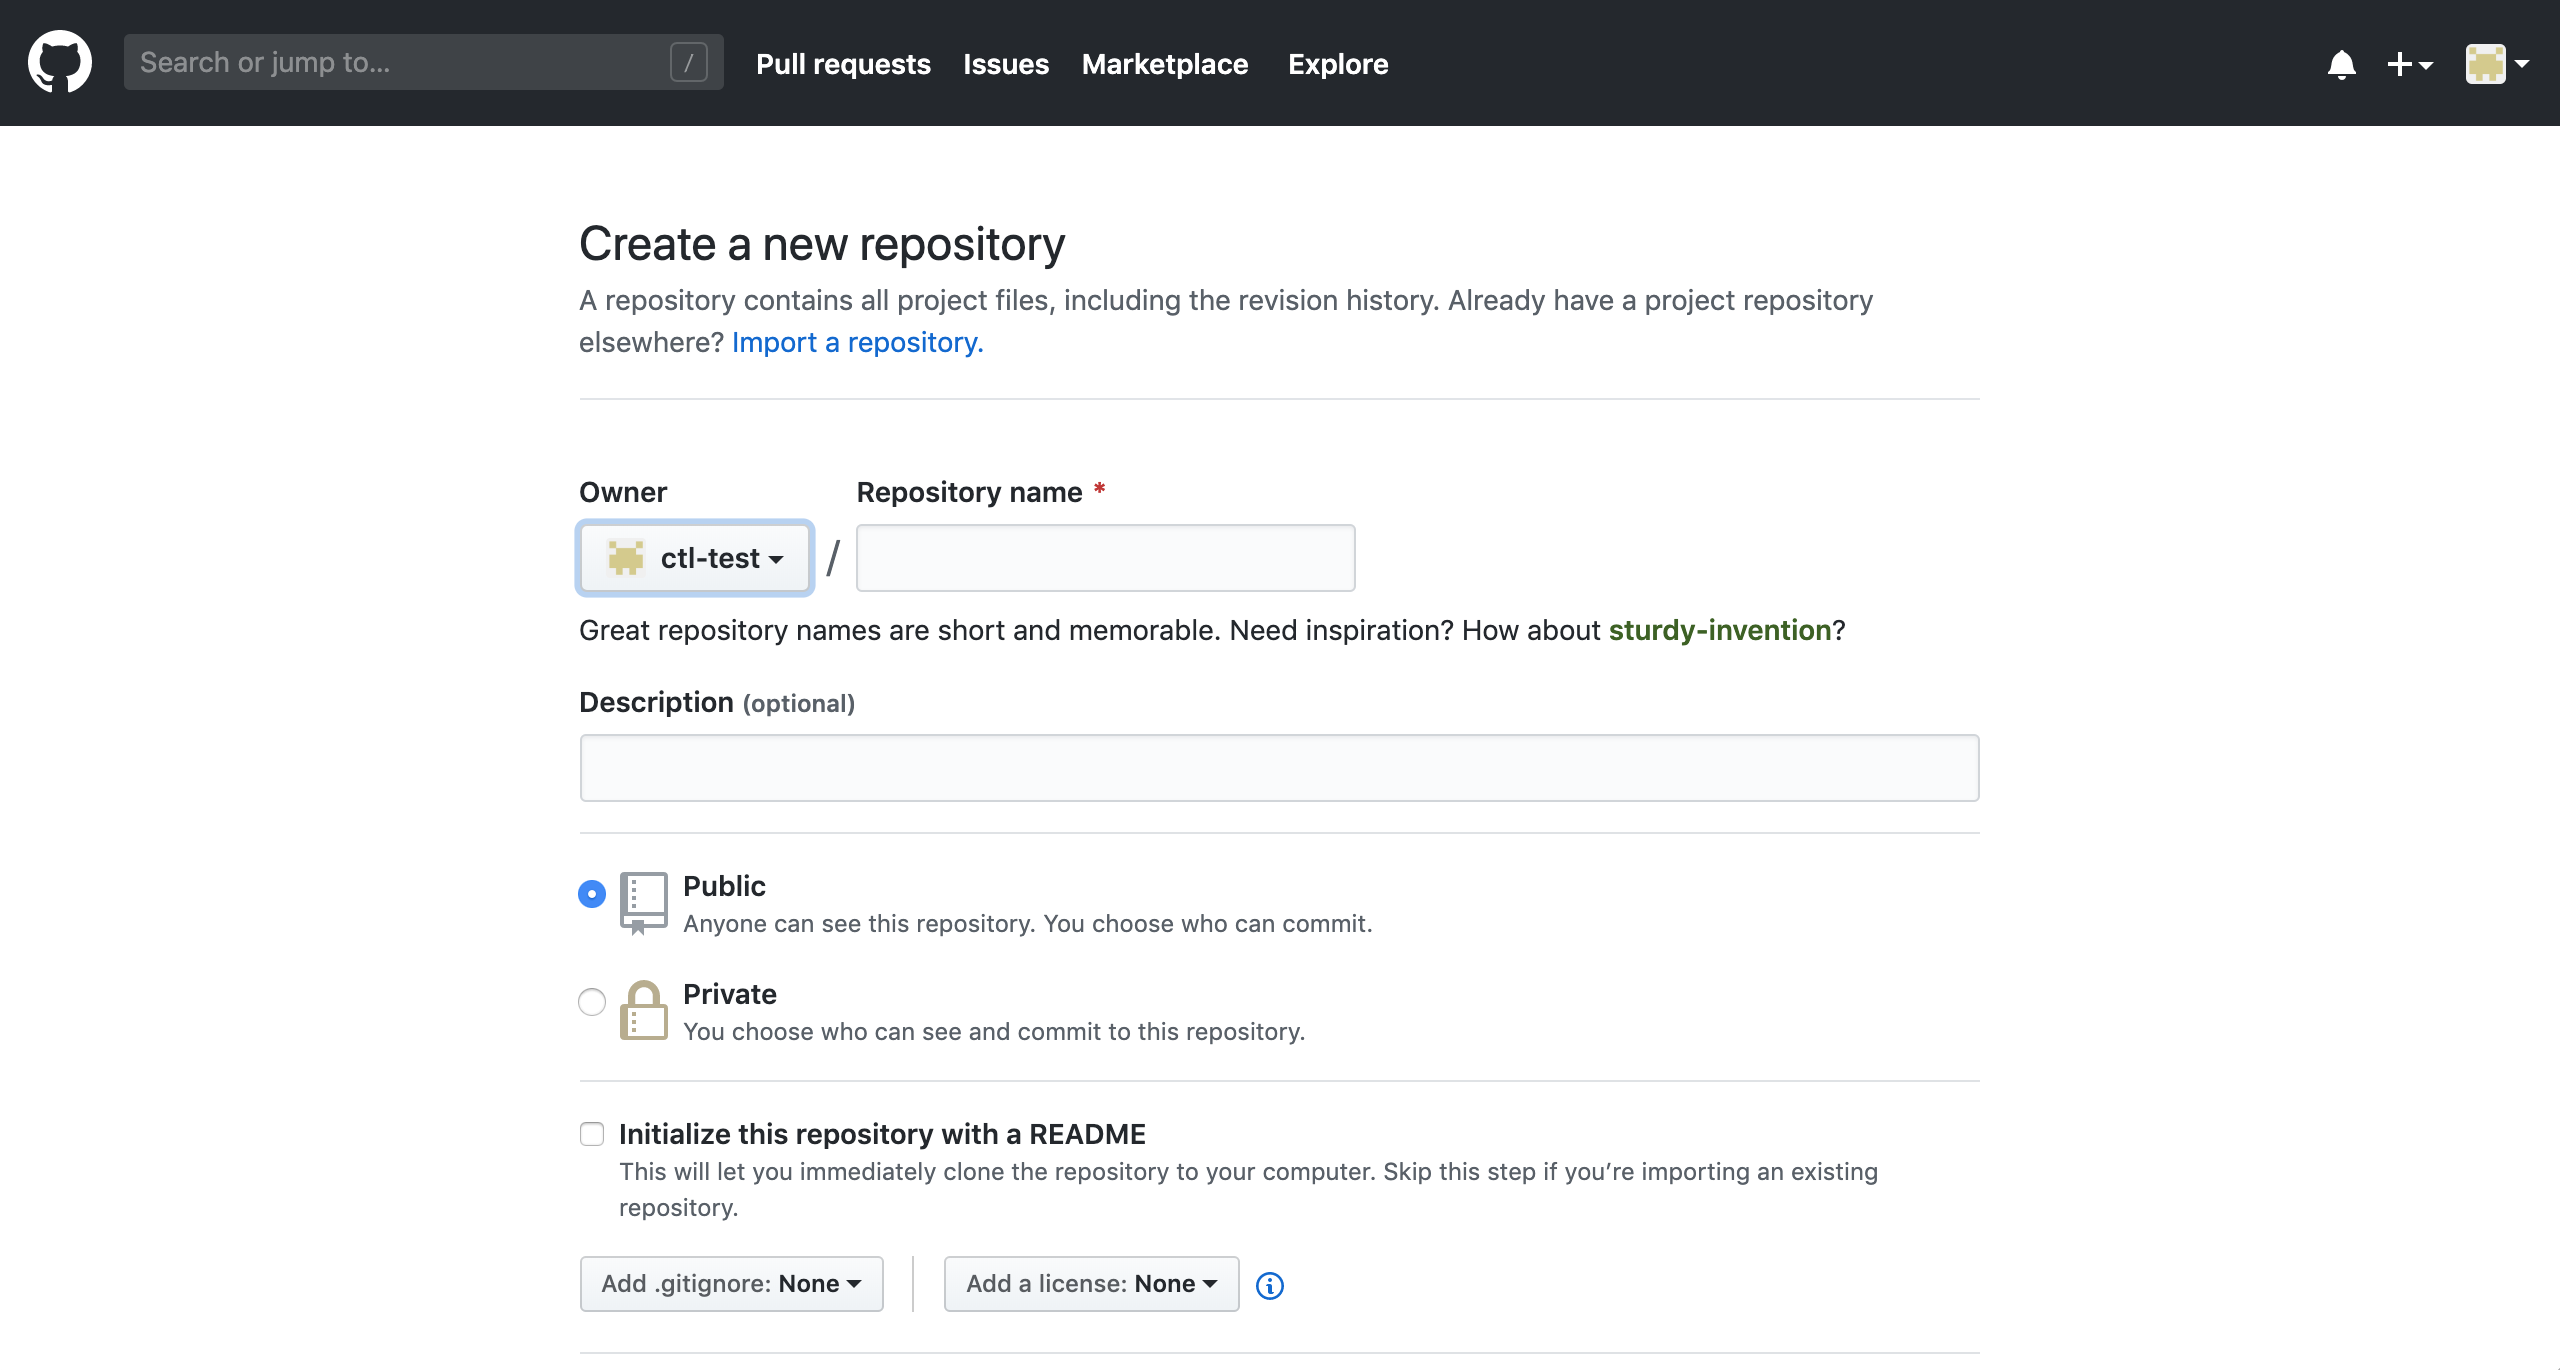
Very important!!!1!!1!
This is where we need to set our repository name to equal exactly this structure:
Step 3: Uploading your code
Now we need to upload our files to the Github repository. Hopefully after you created your repository you should see the below page. What we want to do is click the link that says uploading an existing file

After that, if you drag your HTML, JS and CSS files (if you have them) onto the upload section, they should upload to your repository. BUT! You need to 'commit the changes' for them to be saved.
Step 4: Commiting your changes
This section is also relevant if you want to update your files too. Everytime you make changes to the files, you have to 'commit them'. To the Git repository, that basically means, storing these new files, committing them to memory.
Github makes this part quite easy. If you want to add a message you can do, but if not, all you have to do is click Commit changes and your files will be stored in the git repository.

Step 5: Viewing your website
It may take a couple of minutes but, after you have uploaded your code, you should be able to see your website running at
Congratulations!
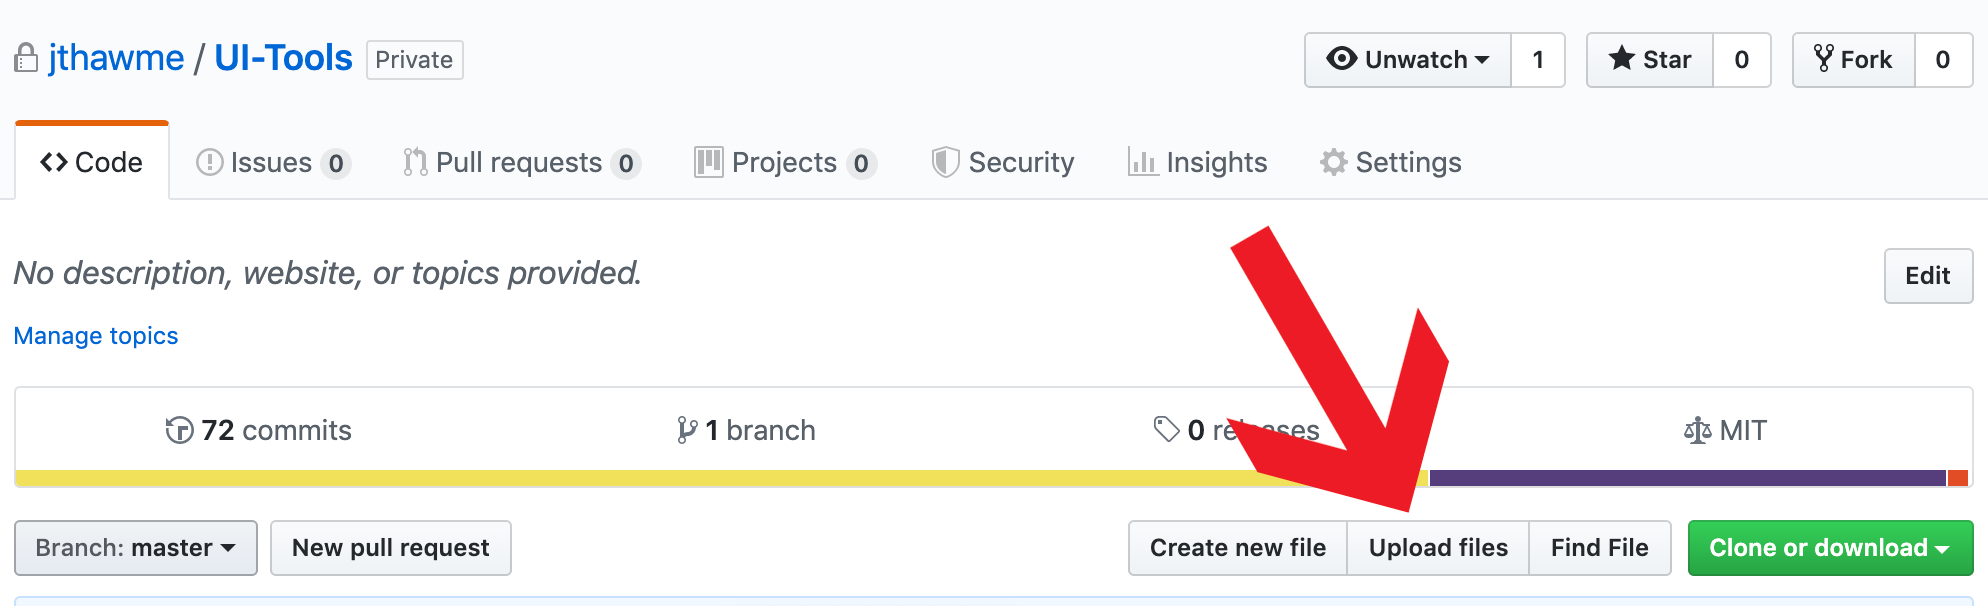
Step 6: Updating files
To update files so that you make your newest files available on the internet, you need to follow the same as Steps 3 & 4. The only difference is you now click that says Upload files which you can find where, below
Optional steps
Everything in this section isn't necessary but it might help you out, to work faster and better!
Step 7: Using a Git application
We can download github's application to help speed up commiting files. You can download the program here: https://desktop.github.com/. Once you've downloaded it, you need to log in and set up your name and e-mail address. Then you will see all of your repositories on your account.
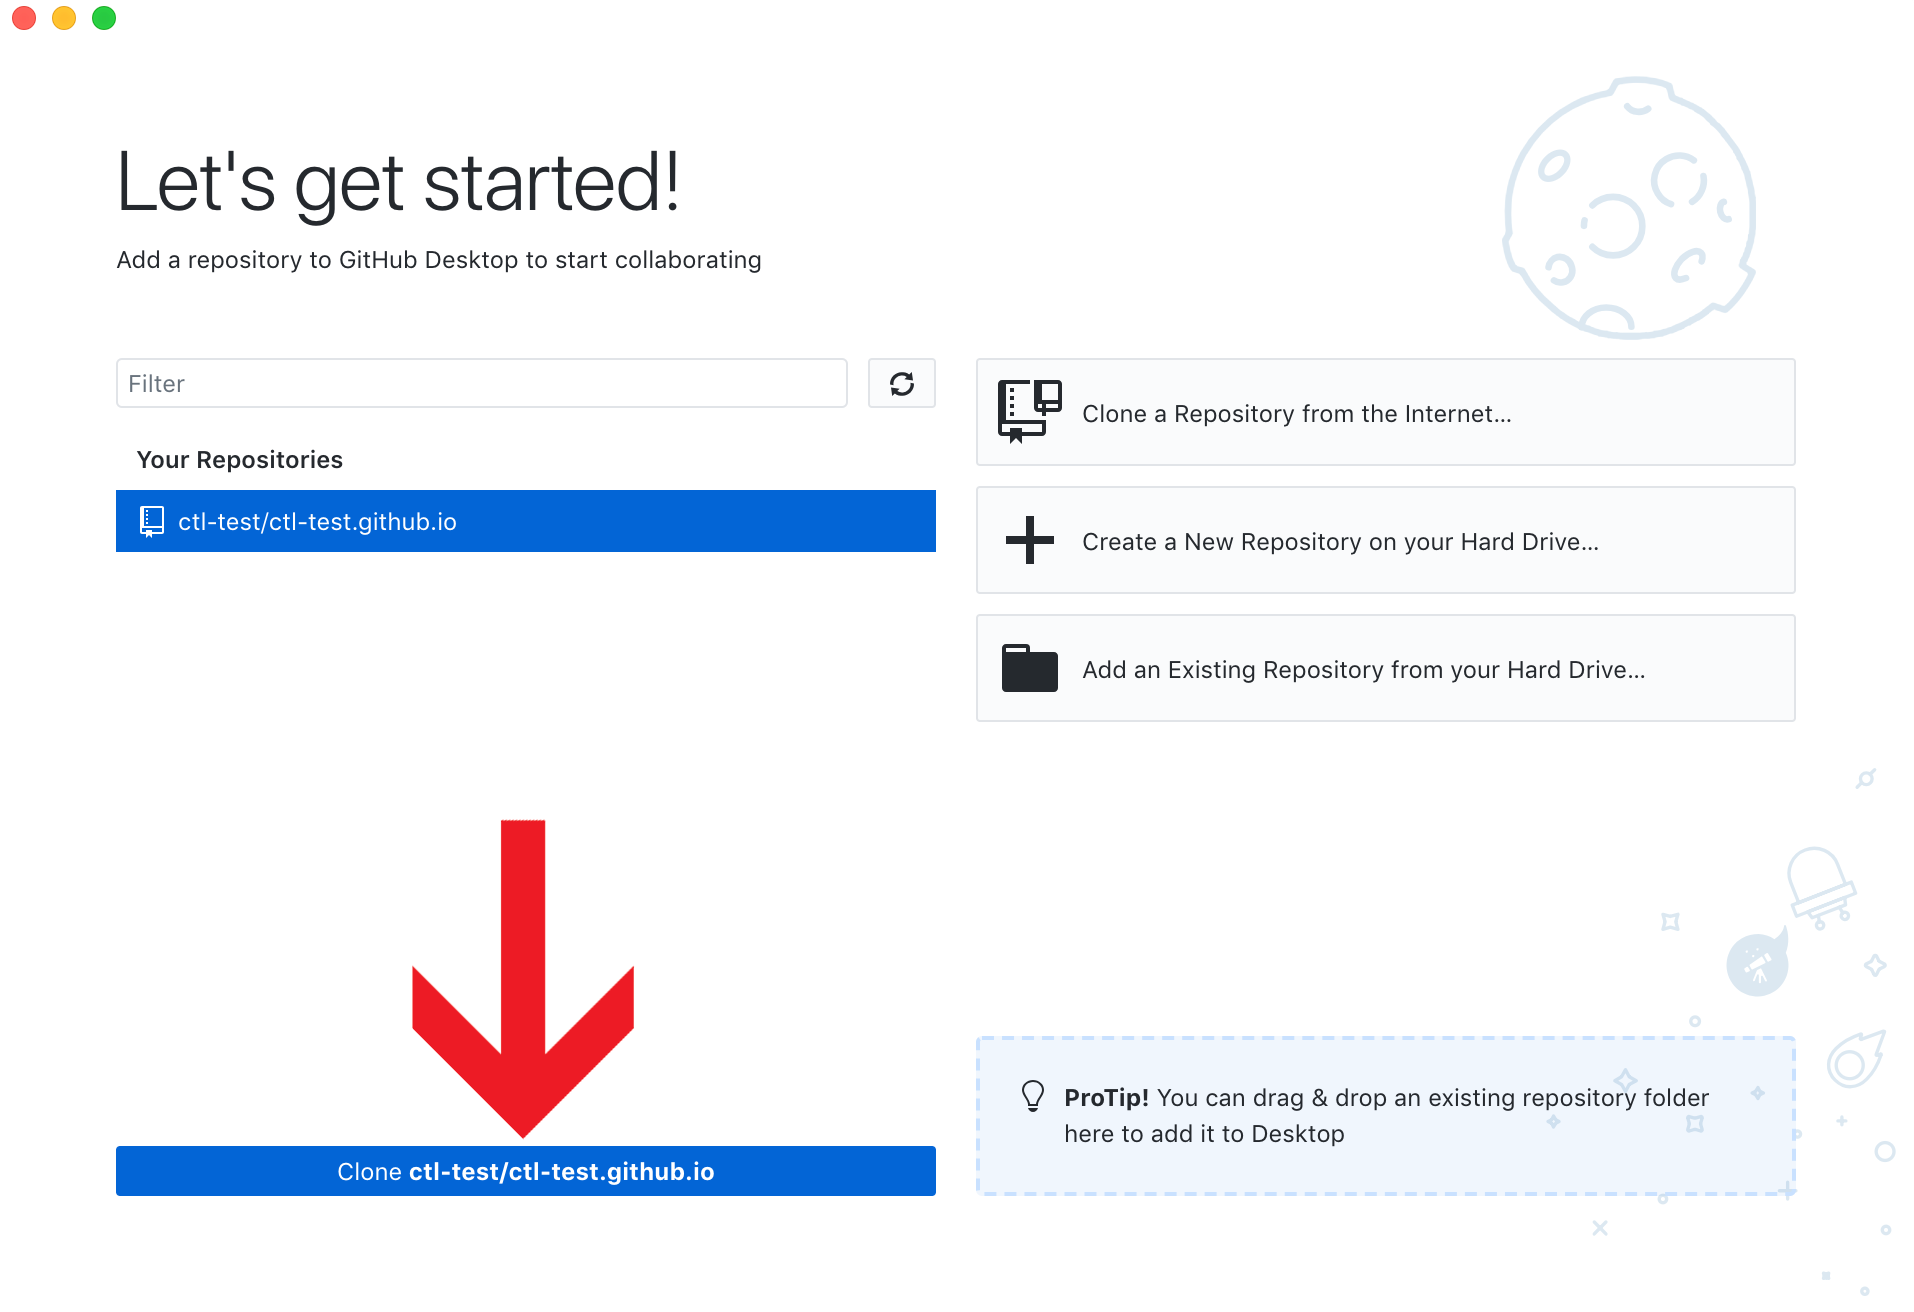
If you click your
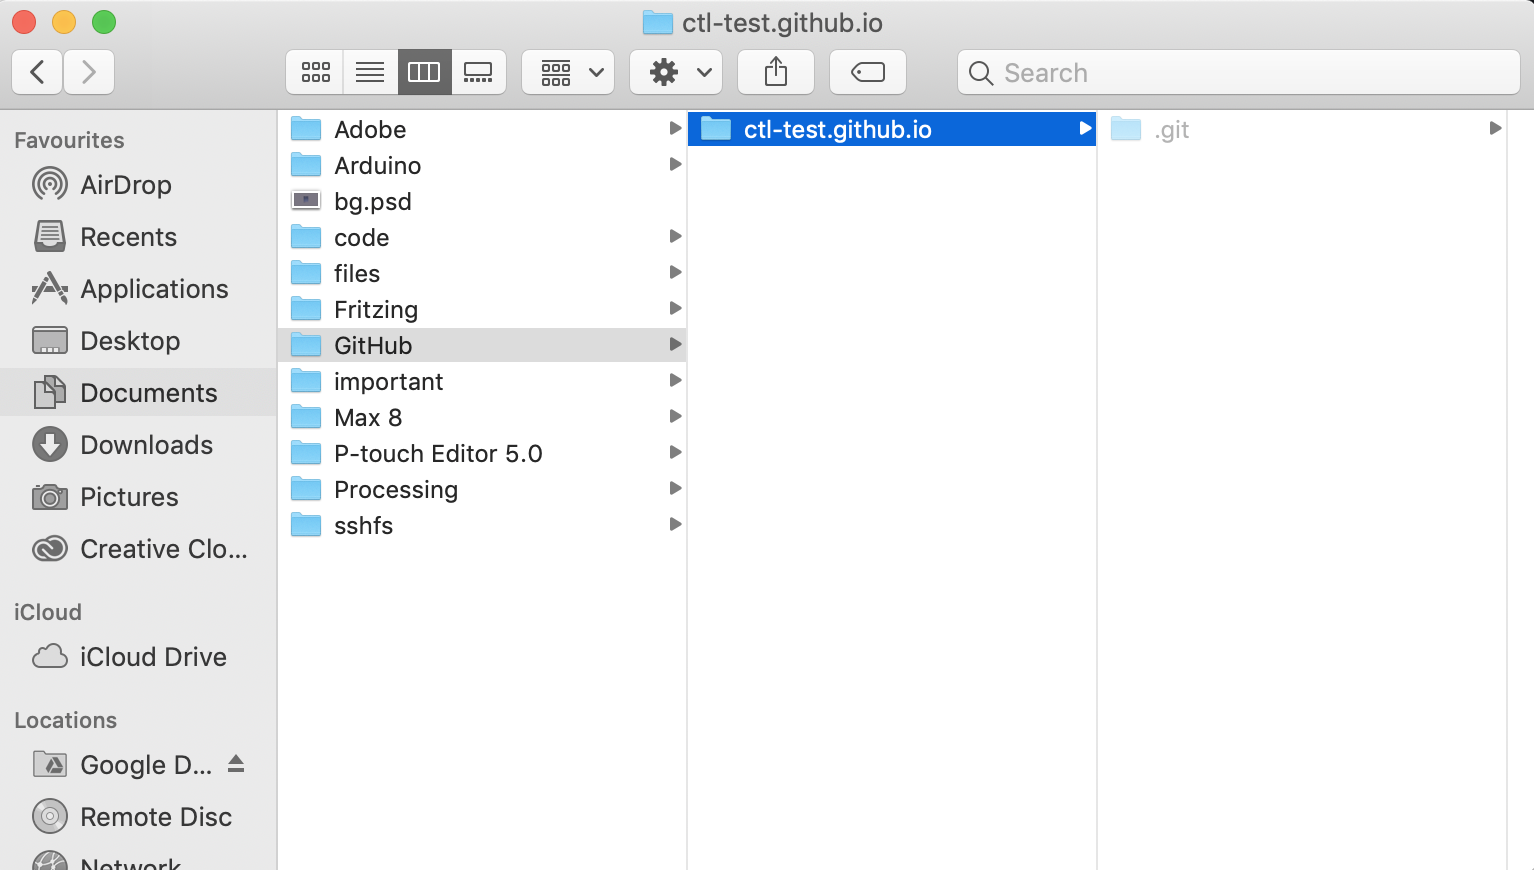
By default it will download the repository to this location: Documents/Github/REPO_NAME
When you make changes to your files, if you check Github Desktop again, you should see that its detected changes in your files.
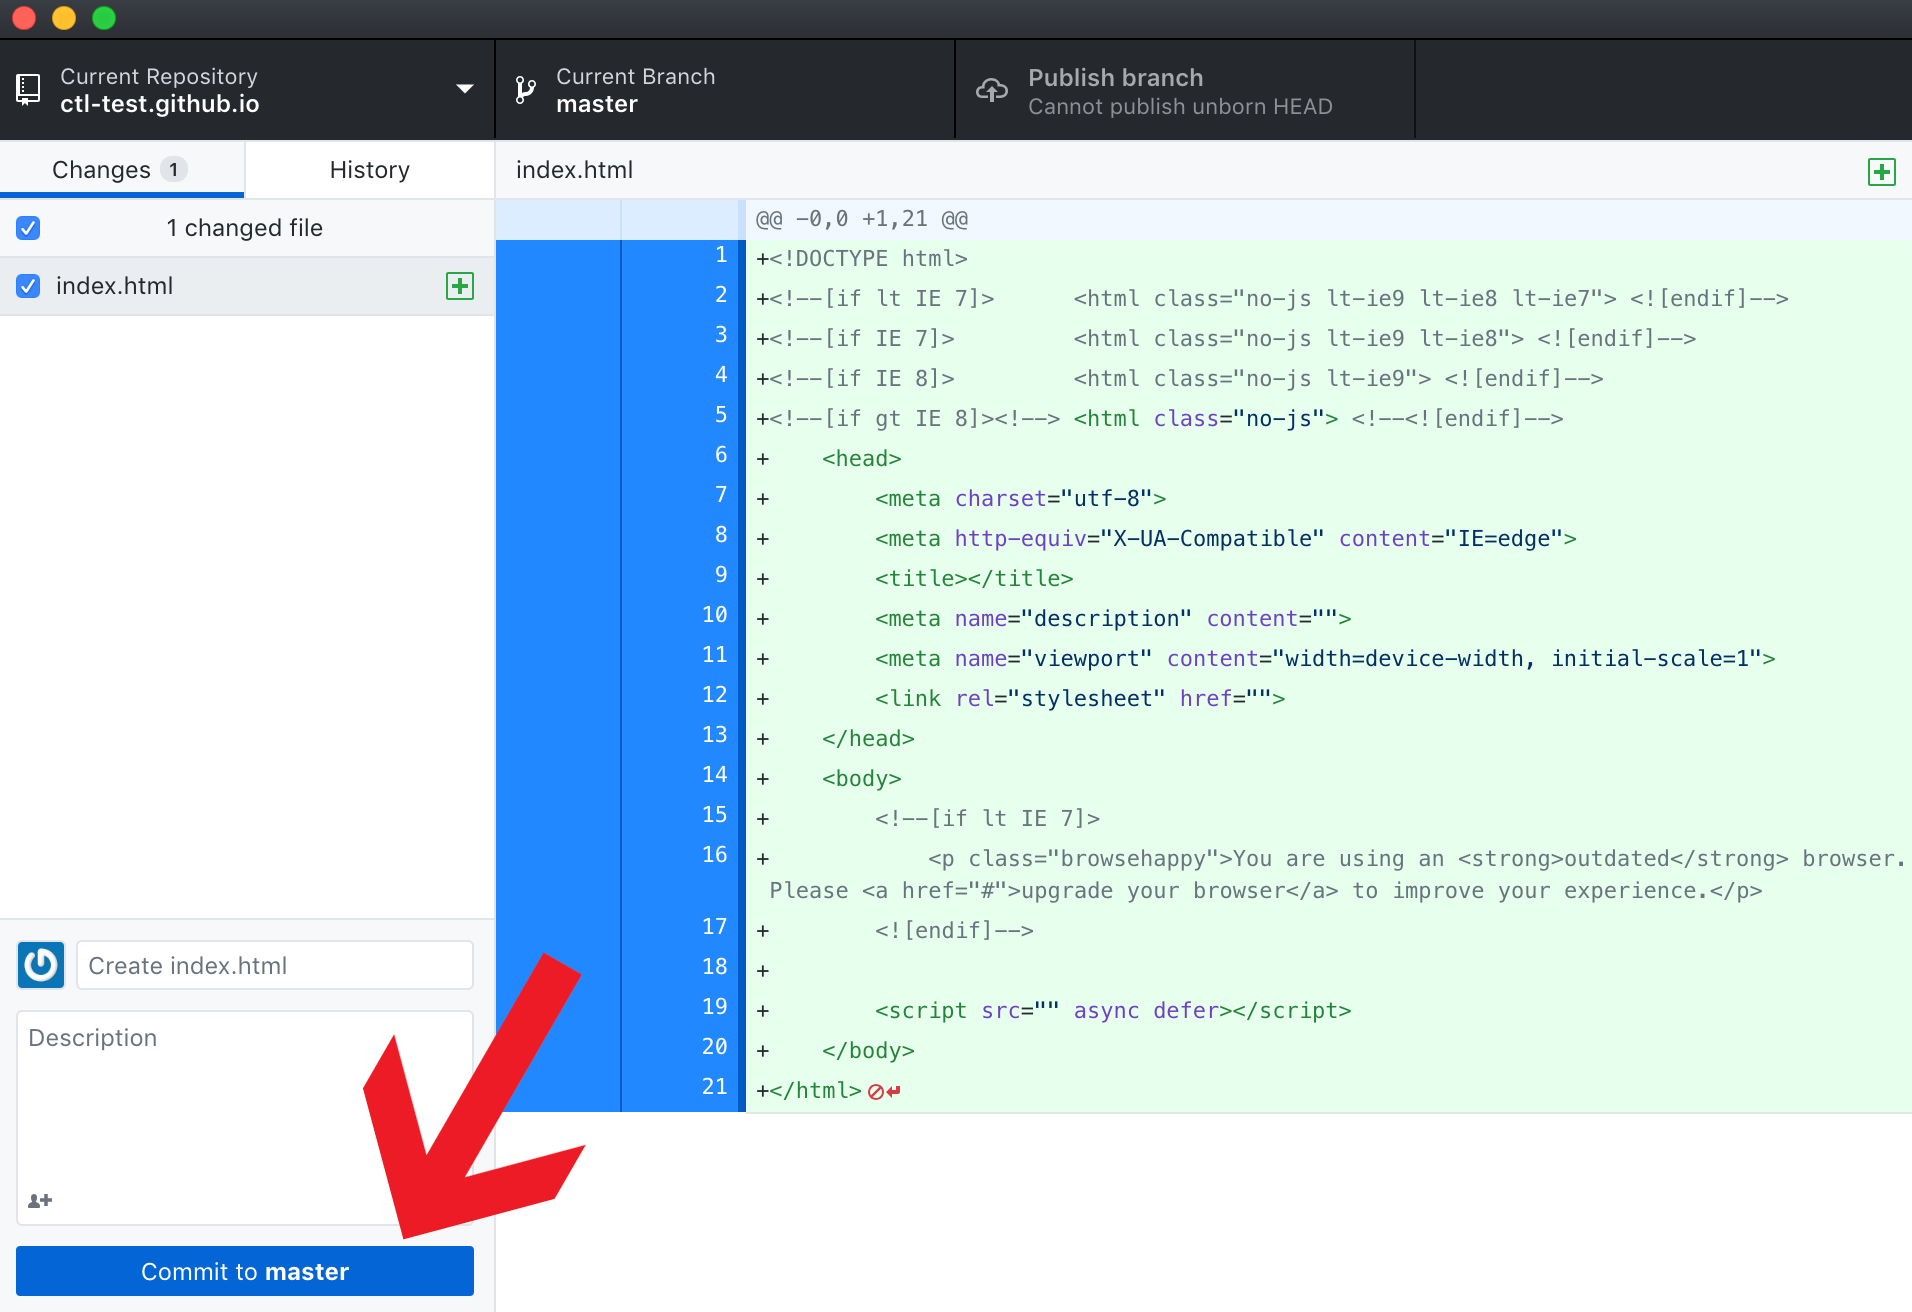
After you commit them in Github Desktop, in the bottom left of the screen (similar to Step 4) you can then publish the changes to your website

How to export your p5.js as a video
How to Video Capture your p5.js Sketch
If you're creating a piece of time-based work in p5.js you may want to capture the canvas as a video. For example, if you have a generative design that evolves over time, or an animation sequence. In this tutorial you will learn how to:
- Download and include a custom library to your p5.js sketch
- Program that library to access your camera as a capture card.
Custom Library
The first step we need to take is to download the custom library for this process. This library can be found at the following Moodle link . Following that link will automatically download a src.zip folder.
make sure you sign into Moodle to access the files.
Once this folder is downloaded you can extract it to either your desktop or downloads folder (anywhere you can easily find it). We are going to upload the files from this folder to our sketch now.
make sure you turn off "auto-refresh" if you have it enabled as this could cause the video capture to crash as you're programming
Your Sketch
- There is a red arrow ">" button beneath the play and stop buttons. Click this to expand the menu which shows all your sketch files. You will need to create a new folder called src and upload all the seperate files from the src.zip you downloaded at the beginning.
If you do not create a folder called src and upload the files into it then you may encounter errors with the next code block. You will see that my files are referened to the path "./src/"
2. Click on the "index.html" file in the side bar. We know need to add the following lines of code in the head of our html file. You should see the default p5.js scripts. Feel free to add these underneath. <script src = "./src/CCapture.js"> </script>
<script src = "./src/webm-writer-0.2.0.js"></script>
<script src = "./src/download.js"></script>
If you don't add these scripts to the head of the html file you will not be able to use the functions. If you encounter errors that describe undefined functions with regard to the capture code then check here first.
- Return to your "sketch.js" file where we can now add the following lines of code to the top of sketch as a global variable. This will create a new CCapture object that we can store in the variable "capture". We also set a captureLength variable. I set it to 60, which will capture 1 second of material at 60 frames per second.
let capture = new CCapture({
  frameRate: 60,
  format: "webm",
});

let captureLength = 60;
- Go to your draw function and put this code at the beginning to start the capturing
  if (frameCount == 1) {
    capturer.start();
  }
This line of code is telling the sketch to start recording once the frameCount == 1.We do this so that the program can run the first frame at setup before beginning to capture. If you wanted to delay the recording by a certain amount of frames you can change the boolean check.
- The last block of code in your draw function should be this. When your program reaches this point it is going to check if the frameCount is still below the captureLength, and if that is true, it will keep recording. The minute the frameCount is over the captureLength the code block is going to evaluate with the else clause which will end the capture and save the output.
  if (frameCount < captureLength) {
    capturer.capture(canvas);
  } else if (frameCount === captureLength) {
    capturer.save();
    capturer.stop();
  }
The Draw Function in Full
function draw() {
  //start capturing
  if (frameCount == 1) {
    capturer.start();
  }

  //start coding

  background(220);

  //stop capturing
  if (frameCount < captureLength) {
    capturer.capture(canvas);
  } else if (frameCount === captureLength) {
    capturer.save();
    capturer.stop();
  }
}
This is a link to a finished version if you're having problems with your own.
Video Exporter Template
Workshop: Introduction to Creative Coding
During this workshop we introduce programming concepts using the web based creative coding library p5.js (https://p5js.org), which is built using JavaScript.
Week 1 - Coordinates, shapes and colour
Outcomes
- Set up development environment
- Understand the principles of locating points on screen
- Drawing shapes
- Understanding additive colour and using RGB colour space
- Use browser-based tools for debugging and logging
- Animate shape or colour using variables
What is p5.js?
During this series of workshops you will be using a library called p5.js to learn the fundamentals of programming. The p5.js project is the most recent part of a complex history of open-source, creative coding libraries going back to the early 2000s. It is supported by the Processing Foundation, which is a not-for-profit organisation that emerged from the creative coding library Processing.
From a technical perspective, p5.js is simply a JavaScript library. A library is a collection of code put together to simplify a task or a collection of tasks. In this case p5.js provides a lot of functionality that makes it easy to draw shapes, colours and handle user interaction within a web page.
This video from Daniel Shiffman is a good introduction to p5.js and the creative coding platforms that preceded it:
Supporting code
The code for this workshop is hosted on Github, which is a web-based repository for hosting and versioning code.
Download the code and unzip it on your desktop.
A p5.js project
In this exercise you will set up a p5.js project using the Atom text editor, then examine the different files and run the code in a browser. The code to support this section is located in the following directory and is available to view on Github:
/00_empty_project/
Topics
- p5.js project structure
- What is a sketch?
- What do the
setup()anddraw()functions do? - Adding your project to Atom
- Using the browser debugging tools
A p5.js project
Below is the structure of a p5.js project, which is essentially a web project made up of HTML and JavaScript files.
/00_empty_project/
  ├── index.html
  ├── libraries
  │   └── p5
  │       └── p5.min.js
  └── sketch.js
index.html
p5.js is a JavaScript library designed for drawing to a web page. For JavaScript code to run in a browser it needs to be included in a HTML file. The index.html file is the 'entry point' for the browser to access our project code. Note the use of the <script> tag to import two JavaScript files (line 7 & 8).
The first JavaScript file (libraries/p5/p5.min.js) is the p5.js library containing a vast amount of code that we can use without having to fully understand.
The second JavaScript file (sketch.js) is where we write our own code.
sketch.js
Below is the minimum required code for a p5.js sketch. This is simply an empty template for us to start coding and will not produce any visual results.
To summarise, we now know that when the browser loads the index.html file, it will import the p5.js library and the sketch.js file, and then execute the code we have written.
setup() and draw()
Within the sketch we have two functions: setup() and draw(). p5.js calls/runs these functions for us in a particular order. The setup function runs first and only once. The draw function then runs repeatedly until the web page is closed.

Debugging
When coding in any language and with any level of experience or expertise, you will almost always encounter bugs. Writing code is often a trial and error process. Therefore, to be productive programmers we need debug our code in order to identify and fix problems. This means using tools to show us where errors in our code occur whilst it is being executed in its runtime environment.
p5.js is written in JavaScript and therefore the environment for running our code will be the browser. There are developer tools built into all the major browsers that van be used for debugging. For now, we recommend using Chrome so we are all using the same tools throughout the workshop. Chrome has an easy to use and fully featured set of developer tools also known as DevTools.
- Take a look at Chrome's instructions on how to use the DevTools, in particular the Accessing the DevTools section
- A more involved introduction to developer tools from HTML5Rocks.
- p5.js has a very good Field Guide to Debugging. It explains that debugging is a creative problem solving task and stresses the importance of taking time to observing the problem in order to understand it.
Exercise
- Add the
00_empty_projectdirectory to Atom - Open
index.htmlin a browser - Use the developer tools to see logged messages
Coordinates and Shapes
In this exercise you will learn how to locate and target positions (i.e. pixels) on screen for drawing. We will also learn how to use some basic functions of p5.js for making primitive shapes. The code to support this section is located in the following directory and is available to view on Github:
/01_coordinates_and_shapes/
Topics
- Comments
- Using p5.js functions
- Drawing some simple shapes
- Locating points on the screen using Cartesian Coordinates
Comments
When writing code it is a good idea to sometimes write notes to yourself or other coders to explain what the code is meant to be doing. The way we do this is by adding comments. Comments can be added in two ways:
- Single line comment
Using the double forward slash (//) at the beginning of the line instructs the browser to ignore that entire line.
// This rectangle is the button that starts the game.
rect(20, 100, 50, 100);
- Block quotes
A forward slash and an asterisk (/*) will start the comment block and the reverse, an asterisk and a forward slash (*/), will end it. The browser will ignore everything in between, which can be multiple lines of notes.
/*
This is a reminder that the code below is not complete yet.
It might be improved by taking this code and making it into
a function of its own.
*/
You will see comments used in this exercise to ignore lines of code that are incomplete or contain errors.
p5.js drawing functions
We will address functions in more detail later but here is a brief explanation. A function is multiple lines of code that achieve a specific task. These are grouped together and given a name so that they can be used again and again.
Later on we will write our own functions but, for now, we will use some functions that are provided by the p5.js library.
-
createCanvas(800, 450)
This is called insidesetup()to create a drawing area of a certain width and height – in this example the canvas is 800 pixels wide and 400 pixels high.
-
rect( 50, 100, 200, 40 )
This function draws a rectangle 50 pixels from the left of the canvas (x), 100 pixels from the top (y). The width of the rectangle will be 200 pixels and the height will be 40 pixels.
Cartesian Coordinates
To understand how to position elements on screen we need to go back to school. When drawing to a screen on the majority of programming languages will use a version of the Cartesian Coordinate system.
It was a system developed in the 17th Century by René Descartes for locating unique points on a mathematical representation of a 2D plane using numerical pairs; e.g. (50, 100), (251, 122). This revolutionised the fields of geometry and algebra centuries before the first computer screens.
For our purposes, the numerical pairs represent the number of pixels counting from left to right (x) and top to bottom (y). For most, the diagram on the left will be familiar for plotting points on a graph:

(image credit: https://processing.org/tutorials/pixels/)
The only difference between plotting points on a graph and on a screen using code is that (in nearly all languages) we plot points on a screen starting from the top left corner rather than the centre. You need an x value (horizontal position) and a y value (vertical position) in order to specify a pixel position on screen.
Using coordinates in functions
In our code we call the following function:
rect( 50, 100, 200, 40 );
The function accepts 4 arguments that define the position and shape of the rectangle:
rect( x, y, width, height);
Therefore the result of this will be the following:

Each function in the library can take different arguments depending on its purpose. For example, when defining a line we do not specify the width and height because lines are 1 dimensional (they have zero or negligible height). Instead, a line is better defined by a start and end position on our screen; two sets of Cartesian Coordinates:
line(x1, y1, x2, y2);
Below is a diagram showing how this using the cartesian coordinates system.
 (image credit: https://processing.org/tutorials/pixels/)
You will not be expected to instinctively know what arguments to give to a particular function like line() or rect(). When using libraries written by someone else, it is common for the authors to provide online documentation describing each of the functions.
Documentation
We know from our sketch that the rect() function accepts a minimum of 4 arguments: x, y, width and height. Without being told, how do we know what these parameters mean? And what about other functions like triangle() or quad()?
To find out, we check the online documentation provided by the authors of the library or programming language. You can search online for the function you are using and the documentation will give you all the information you need to use it, typically with some useful examples. We can check the reference for p5.js, and specifically the page that explains the line function.
Exercise
- Add the
01_coordinates_and_shapesdirectory to Atom - Open
index.htmlin a browser - Change the position, width and height of the rectangle
- Draw a line
- Draw an ellipse, triangle, or quad
Colour
The code to support this section is located in the following directory and is available to view on Github:
/02_colour_stroke_fill/
RGB Colour Space
When defining a colour in code, we need to describe it numerically using a 'colour space'. The most common colour space used in computing is RGB (Red, Green, Blue). Those with experience of graphical software such as Photoshop will be familiar with the colour selector that shows you the RGB values as your move around the colour palette:

An RGB colour can be understood by thinking of it as all possible colours in the visible spectrum that can be made from combinations of red, green, and blue light. By defining the intensity of each of the three colours that are mixed together, it's possible to pick from over 16 million different colours. Arguably more than the human eye can see.
In practical terms, we specify the individual amounts of red, green, and blue using values between 0 and 255.
For example, this describes the colour red:
255, 0, 0 <---- RED
This describes green:
0, 255, 0 <---- GREEN
And this describes the orange colour used on this website:
255, 152, 0 <---- ORANGE
Additive colour

In contrast to subtractive colour models, such as CMYK used for paints and print, the RGB colour space is additive. When you mix the primary paints or pigments together the resulting colour will become increasingly dark, working its way towards black. With colour displayed on a computer monitor or mobile device, adding red, green and blue together will provide white.
If you want to know all there is to know about colour theory then read Joseph Alber's amazing book, Interaction of Colors.
Using colour functions
In the p5.js library there are functions provided for controlling the colour of the fill and stroke of shapes.
-
fill(r, g, b)
This determines the main body of colour inside a shape. -
stroke(r, g, b)
This defines the colour of the line that surrounds the shape.
Here are some examples of giving three arguments (r,g and b) to the fill and stroke functions:
-
fill( 255, 0, 0 )// red shape fill -
fill( 255, 255, 0 )// yellow shape fill -
stroke( 0, 0, 255 )// blue outline -
stroke( 255, 0, 255 )// magenta outline
Grayscale
Another feature of these functions is the ability to use them to define grayscale values. Passing a single argument between 0 and 255 will result in a colour between black and white:
-
fill(0)// black shape fill -
fill(255)// white shape fill -
stroke(150)// grey outline
Order is important
When calling these functions you are defining the fill and stroke colour for all the shapes you draw after that line of code. So it is important to pay attention to the order in which you use them.
Exercise
The code below draws a selection of shapes around the canvas. They are all coloured white, gray or black. Your task is to add some colour to this situation.
- Add the
02_colour_stroke_filldirectory to Atom - Open
index.htmlin a browser - Change the fill and stroke colour for each shape
Simple Interaction and variables
The code to support this section is located in the following directory and is available to view on Github:
/03_simple_interaction/
p5.js defines some variables that we can use in our code about the properties of the sketch and also user inputs (e.g. mouse and keyboard). We can use these to make our code easier to maintain, more flexible, and to possibly add some basic interactions.
What is a variable?
A variable is how we store useful values in code. The types of things we can store depends on the programming language being used, but common examples are numbers and text.
Think of a variable as a container or box. The value is the thing inside the box, and the label on the front of the box is the name we use to identify it.
var myNumber = 5;
var myText = "hello";
In reality, the variable's container is a small section of memory on your computer.
p5.js provided variables
After you've called the createCanvas(width, height) function, p5.js automatically stores the specified dimensions as variables named width and height that can be used throughout your sketch. For example, you can use those variables to calculate and draw something in the exact centre of the canvas:
rect(width/2, height/2, 20, 20);
Special variables, such as mouseX and mouseY are made available by p5.js. These are extremely useful if we want to make sketches that respond to the user's mouse input. These two variables contain the x and y coordinates of the user's mouse at that precise moment. We can use changing values to modify our drawing and create something more dynamic.
Exercise
- Add the
03_simple_interactiondirectory to Atom - Open
index.htmlin a browser - Change the provided code so that a shape follows the mouse around the canvas
Week 1 Assignment
For the next workshop, I would like you to make a portrait (self or other) using what you've learned from week 1. You should use the following functions and variables:
rect()ellipse()triangle()fill()stroke()mouseX / mouseY
I would like you to use Codepen to submit your work. Codepen is an online code editor for web based technologies (HTML, CSS & JavaScript) as well as a platform for sharing your code. I have created a template for you to use that already includes the p5.js libraries:
http://codepen.io/pen?template=zKLpKw
Follow the link above and then edit the code in the JS panel. Click Save and you will have created a 'pen' with a unique URL (see below). Submit the Codepen URL to our Slack channel before the next workshop.

Week 2 - Animation, conditionals & random numbers
Outcomes
- Understand variables and how to use them
- Understand functions and how to use them
- Using conditional statements to control code flow
- Using variables for animation
- Using random numbers
- Mapping values from one range to another
Supporting code
The code for this workshop is hosted on Github, which is a web-based repository for hosting and versioning code.
Download the code and unzip it on your desktop.
During this workshop session we will be using the following project directories:
04_using_variables/
05_animation/
06_conditionals/
07_random/
08_random_recursive_tree/
09_map_weather_api/
10_map_hsb_colours/
Variables
Firstly let's take another look at variables in a bit more detail. A variable is simply a way of storing information in the computer's memory. Let's dive right in with an example...
var rectWidth = 5;
Let's break down the above statement:
-
var- This is how the browser knows you are 'declaring' a new variable -
rectWidth- This is the name of the variable, which we can refer to later in our code. What you call a variable is up to you but there are some conventions. -
5- The value which we want to store in the computer's memory
Read more about variables in JavaScript
Using variables
The code to support this section is located in the following directory and is available to view on Github:
/04_using_variables/
Now that our variable rectWidth is stored in memory, we can access it using its name to return the stored value.
var rectWidth = 5;
var rectHeight = 7;
var rectArea = rectWidth * rectHeight;
console.log(rectArea); // This will write 35 to the console.
In this example, a new variable rectHeight is declared and assigned a value of 7. On the third line both the previous variable values are retrieved from memory and multiplied using the multiply operator (*). This is immediately stored in the rectArea variable before finally being logged to the console.
Here is what happens line by line:
- Store the number 5 in a variable named
rectWidth - Store the number 7 in a variable named
rectHeight - Multiply the values in
rectWidthandrectHeight, storing the result in a variable namedrectArea - Log the value of
rectArea
Exercise
- Add the
04_using_variablesdirectory to Atom - Open
index.htmlin a browser - Open and look at the console in the browser's developer tools
- Remove the comments at the beginning of line 20 and reload your browser
Animation using variables
The code to support this section is located in the following directory and is available to view on Github:
/05_animation/
In this exercise a variable will is used to store, retrieve and increase a value. This value will represent the position of a shape drawn to the canvas.
Here is a portion of the code extracted from the provided example:
var positionX = 0;

/*
[code excluded]
*/

function draw(){
  // Set the background to black every frame
  background(0);

  // Draw a rectangle that moves along the X axis
  rect(positionX, height/2, 10, 10);

  // Increase the value stored in positionX
  positionX = positionX + 1;
}
As you can see a variable called positionX is declared and assigned a value of 0. Importantly this variable is declared outside of the function where it is later used. The variable is declared in the global scope (more on this later) making it accessible throughout the entire application (i.e. globally).
Exercise
- Add the
05_animationdirectory to Atom - Open
index.htmlin a browser - Use the conditional
ifstatement to reset the square to position 0. - Increase the speed of the rectangle
- Move the rectangle on the X and Y axis
Conditionals
The code to support this section is located in the following directory and is available to view on Github:
/06_conditionals/
A conditional statement is used to control which code is executed based on certain pre-determined conditions. This process is one method of controlling the flow of our application.
If statements
Conditional statements are written in code using the if keyword. In fact, conditional statements are often referred to as if statements. Below is an example of how a conditional statement is formed using the if keyword:
if (condition) {
  // code that runs if the condition is true
}
By replacing the condition above with other statements we can start to control what parts of our code are executed under which conditions.
You can think of this as a very simple flow diagram or decision tree. If condition A is TRUE then the code block runs, however if it's FALSE the code is ignored.

Is the statement true or false?
When writing a condition, commonly known as a conditional statement, the truth of the statement is being evaluated or checked. In the following examples this happens by comparing two values. These values can be variables, literal values or a combination of the two.
Literal values are those that we write in our code literally.As opposed to variables that can change, these values are written explicitly in our code and do not change. Here are some examples:
"Hello, World"
12
3.141592
Here are some practical examples of if statements that use both variables and literal values. Between each set of brackets is a statement comparing two values. Those comparisons will return a value of true or false, which determines if the code within should be executed or ignored.
if( userName == "bob" ){
   // Any code in here will run when userName is equal to ('==') "bob"
}

if( durationHours > 12 ){
  // Any code in here will run when durationHours is greater than (`>`) 12
}

if( rectArea <= 35 ){
  // Any code in here will run when rectArea is less than OR equal to ('<=') 35
}
Comparison operators
In conditional statements, a comparison operator sits between the two values and is used to determine whether the statement is true or false. Below is a list of conditional statements using different comparison operators.
A == B |
A equal to B |
A != B |
A is not equal to B |
A > B |
A is greater than B |
A < B |
A is less than B |
A >= B |
A is greater than or equal to B |
A <= B |
A is less than or equal to B |
If the statement is true then the code within the conditional will run. Here are some more practical examples:
value1 == value2
userName == "bob"
playerScore >= 10
"west" == windDirection
juneTemperature > mayTemperature
Let's break down one of the above conditions:
-
userName
A variable – as the word 'variable' suggests, we expect it may change. -
==
A comparison operator checking for equality – checks if the value on the left is equal to the value on the right. -
"bob"
A string literal – written explicitly and therefore will not change.
Since variables can change value throughout the execution of code, the comparison to a static value causes code to run only during particular conditions.
If variables are named well you can start to read through the logical steps of your application by reading the code as human language:
if the userName is equal to "bob"
  then do something
Always be sure to use the double equals sign in conditional if statements. Using the single equals sign will change the value stored inside the variable.
Exercise
- Add the
06_conditionalsdirectory to Atom - Open
index.htmlin a browser - Modify the code inside the first conditional to make the ball bounce off the right side of the canvas
- Use another conditional to make the ball bounce off both sides of the canvas
- Change the colour, size, speed of the ball when it bounces off the wall
- Move up and down instead of left and right
Using random numbers
The code to support this section is located in the following directory and is available to view on Github:
/07_random/
Most programming languages provide functions for generating random numbers. This can be very useful in providing some variations to deterministic behaviour of code.
In p5.js there is a function for generating a random number between a minimum and maximum value:
random(min, max);
The min and max arguments set the minimum and maximum values that can be returned from that function.
random(0, 10);
random(120, 180)
random(15, 22);
You can also use a variable as one of the arguments:
random(0, width);
random(0, height);
The random() function can be used to set properties of shapes in our sketch such as position, size or colour.
In the following example the positionX and positionY variables are assigned values that are half of the width and half of the height of the canvas respectively. This will place the ellipse in the centre of the canvas when the code runs.
var positionX;
var positionY;

function setup() {
  createCanvas(800, 450);
  // Assign a value to the variables
  positionX = width/2;
  positionY = height/2;
}

function draw() {
  // Use the value within the variables.
  ellipse(positionX, positionY, 10, 10);
}
Here is an example of how to use the random function to change the starting position of the ellipse to a random position on the canvas on every execution of the code.
var positionX;
var positionY;

function setup() {
  createCanvas(800, 450);
  // Assign a value to the variables
  positionX = random(0, width); // Random number between 0 & 800
  positionY = random(0, height); // Random number between 0 & 450
}

function draw() {
  // Use the value within the variables.
  ellipse(positionX, positionY, 10, 10);
}
For an in-depth look at how random numbers relate to other programming concepts such as probability, evolutionary programming and the 1982 sci-fi classic Tron, take a look at Daniel Shiffman's free online book The Nature of Code.
Exercise
- Add the
07_randomdirectory to Atom - Open
index.htmlin a browser - Change the X and Y positions of the ellipse using
random()on every frame - Change another feature of the shape with random (size, colour, etc)
Randomness and probability
The code to support this section is located in the following directory and is available to view on Github:
/08_random_recursive_tree/
- Add the
08_random_recursive_treedirectory to Atom - Open
index.htmlin a browser and you will see something similar to this:

This is an example of using randomness and probability to produce organic forms. Take a look through the code and you will see some lines such as this:
// Create a random numbers between 0 and 1
var r = random(0, 1.0);

// 98% chance this will happen
if (r > 0.02) {
  [code excluded here]
}
// 2% chance this will happen
else {
  [code excluded here]
}
You can see that by using random numbers and conditional statements you can quite easily create systems that have interesting and unexpected results within the limits of probability.
This code also uses a very powerful technique called recursion, which is beyond the scope of this workshop. Essentially the code is self-referential and therefore within very few lines of code can create complex outputs.
Mapping values
The code to support this section is located in the following directory and is available to view on Github:
/09_map_weather_api/
A common programming task – particularly when visualising information – is to take a value that is changing within one range and mapping that onto a different range.
As an example, let's think about visualising the current temperature (a changing value) by drawing a thermostat.
 |
 |
|---|
We know that the value is going to be in this approximate range of 0 to 50 °C and the size of the red thermostat indicator is a shape with a height between 0 and 200 pixels:
| MIN | MAX | |
|---|---|---|
| °C | 0 | 50 |
| pixels | 0 | 200 |
Let's assume we have retrieved the current temperature in degrees centigrade, for example through a weather API.
If the temperature is 50°C, the height of the red bar would be 200 pixels; if the temperature is 0°C, the height would be 0 pixels; and if the temperature is 25°C (half way point of the range), the height would be 100 pixels (half the height).
| Current Temp (°C) | Height (pixels) |
|---|---|
| 0 | 0 |
| 50 | 200 |
| 25 | 100 |
| 10 | 40 |
| 35 | 140 |
Using the map function
Within p5.js there the map function performs the calculations that translates one range onto another. The map() function takes 5 arguments:
map(value, fromMin, fromMax, toMin, toMax);
So using the example of the thermostat, we would convert the current temperature stored in a variable called temperature using the following:
map(temperature, 0, 50, 0, 200);
And here are some examples from above using literal integer values:
map( 25, 0, 50, 0, 200 ) // returns 100
map( 10, 0, 50, 0, 200 ) // returns 40
map( 35, 0, 50, 0, 200 ) // returns 140
Exercise
- Add the
09_map_weather_apidirectory to Atom - Open
index.htmlin a browser - Look through the code and find where the
map()function is used - Change the city in the preload function to see the API results from other places
HSB Colour
The code to support this section is located in the following directory and is available to view on Github:
/10_map_hsb_colours/
Using the RGB colour space we can produce as the specific colours we need. However, in order to manipulate or generate colours, the RGB colour space doesn't offer the best tools. For this we can use the HSB colour space or Hue, Saturation and Brightness. It is sometimes also known as as HSL (lightness) or HSV (value).
Within this model the hue defines the colour we see, which is the wavelength of light being produced. The saturation defines how intense or vivid the colour is. The way the colour is desaturated is by the addition of grey: 100% saturation means there is no grey and 0% saturation will result in a medium grey. The brightness determines the amount of black or white that's mixed with the hue.
Here are the RGB and HSB colour spaces visualised:

Changing colour mode
In p5.js you can change the colour space from RGB to HSB using the following.
colorMode(HSB);
The colorMode function can also take 3 more arguments:
colorMode(HSB, 360, 100, 100);
These last 3 arguments represent the range of values we can pass as arguments into the colour functions such as fill() and stroke().
In RGB colour mode, the range is by default:
| Red | Green | Blue |
|---|---|---|
| 0 - 255 | 0 - 255 | 0 - 255 |
But in HSB mode, the hue is usually between 0 and 360 whilst the saturation and brightness are between 0 and 100.
| Hue | Saturation | Brightness |
|---|---|---|
| 0 - 360 | 0 - 100 | 0 - 100 |
The saturation and brightness are essentially represented as a percentage (0 to 100%) of their most extreme condition, which is the least saturated and the most bright.
But why is the hue value between 0 and 360? As mentioned the HSB colour is visualised as a cylinder (or sometimes as a cone) and the hue is represented as the perimeter of the circle that sits at the top of the 3D shape. Therefore the 360 is the angle in degrees around that circle.

Image credit: www.runemadsen.com
Exercise
Using the HSB colour space we can create easily create colour schemes that have a mathematical relationship to each other. A simple example is choosing a particular hue and saturation and then adjusting the brightness. However you can also choose selections of hue based on their relationship around the 360 degrees of the colour wheel.
 Analogous |
 Complementary |
 Triadic |
 Tetradic |
All of these examples are from the Rune Madesen's lecture on colour as part of his Printing Code module at ITP. The online resources from this are extremely useful.
In the provided example, the mouseX value is being mapped from one range (0 to width) onto another (0 to 360):
| MIN | MAX | |
|---|---|---|
| width of canvas | 0 | 50 |
| degrees of colour wheel | 0 | 360 |
Therefore as the mouse moves across the canvas the mapped value travels between 0 and 360. This is then used to set the hue of the fill colour showing the full spectrum of colour.
var colour = map(mouseX, 0, width, 0, 360);
var columnWidth = width/3;

fill(colour, 100, 100);
rect(columnWidth*0, 0, columnWidth, height);

fill(colour, 80, 70);
rect(columnWidth*1, 0, columnWidth, height);

fill(colour, 60, 40);
rect(columnWidth*2, 0, columnWidth, height);
- Add the
10_map_hsb_coloursdirectory to Atom - Open
index.htmlin a browser - Explore different values for brightness and saturation
- Create colour schemes with hues that have are related on the colour wheel, e.g. analogous, triadic, etc.
Functions
Functions are used to define a process that can be constructed of one or more lines of code. They are often used to organise and structure code by the intended outcome or behaviour.
Here are a few benefits to using functions:
- Keep code organised
- Make code easily reusable
- Breaking down a task into smaller pieces (decomposition)
- Making problems in the code easier to identify and troubleshoot (seperation of concerns)
Using functions
Making use of functions is broken down into two parts. First, the function behaviour needs to be defined, i.e. the code needs to be written. Secondly, the function needs to be called (also known as 'executed').
Define the function behaviour
Below are 4 lines of code contained within a function that perform the task of calculating the area of a shape. This is where the function is being defined.
function calculateArea() {
  var width = 5;
  var height = 7;
  var area = width * height;
  console.log(area);
}
Let's break down the unfamiliar parts of the above code:
-
function
This is how the browser knows you are declaring a new function. -
calculateArea()
'calculateArea' is the name of the function, which we can use to refer to later in our code. What you call a function is up to you but there are some conventions. -
{ }
These are curly brackets or curly braces. They start and end the content of the function. All code written between these two brackets is the behaviour of the function.
Call the function
The above code will do nothing until we call the function elsewhere in our code.
calculateArea(); // Logs 35
Function parameters
A common use of a function is to make our code more reusable. One way of making our functions more reusable is by adding parameters.
function calculateArea( width, height ) {
  var area = width * height;
  console.log(area);
}
Assignment
Part 1
Create a sketch that includes:
- one or more elements that changes over time.
- one or more elements that is controlled by mouse or keyboard
- one or more element that is random() in nature
Work can again be submitted using Codepen. Here is the URL for the p5.js template:
http://codepen.io/pen?template=zKLpKw
Please submit the Codepen URL the day before our next workshop.
And here is a short guide on using Codepen:
Part 2
When you submit your URL I would like you to also submit a question about what we've been covering (or have missed) over the last two weeks. For example:
- What does a certain error message mean?
- How do I create a colour with an alpha channel?
- Are there any other colorModes?
- What is the highest framerate?
Week 3 - Iteration, arrays, objects and pixel arrays
Outcomes
- Iteration using while and for loops
- Understand and using arrays
- Using loops and arrays together
- Understanding and using JavaScript objects
- Understanding how colour data is stored in pixel arrays
- Accessing the webcam
Supporting code
The code for this workshop is hosted on Github, which is a web-based repository for hosting and versioning code.
Download the code and unzip it on your desktop.
During this workshop session we will be using the following project directories:
11_iteration_and_loops/
12_iteration_02/
13_loops_and_arrays/
14_pixel_array/
15_image_pixel_array/
16_webcam_capture/
Local web server
So far during this series of workshops testing your code has involved opening the index.html file in your browser, which results in an absolute file path in the browser address bar (see below). You can see this indicated by the file:// protocol followed by the absolute file path to the index.html file:

For some examples you will need to run a local HTTP web server that serves the files in a project. If you have Node.js already installed you can run the following command to install an HTTP web server:
sudo npm install -g http-server
If you receive an error from the above command it's likely that you do not have Node.js installed. In which case visit the Node.js homepage and download/install the LTS version and repeat the command above.
Once you have installed the HTTP web server you will need to change directory (cd) into the project directory on the command line and run the server:
cd ~/Desktop/intro-to-programming-2017/15_image_pixel_array/
http-server
If successful you will see messages in the command line similar to this:

You can then copy and paste one of the URLs into you browser:

Iteration: while and for loops
The code to support this section is located in the following directory and is available to view on Github:
/11_iteration_and_loops/
/12_iteration_02/
Sometimes it is necessary to repeat a task over and over on the same data in order to achieve a desired outcome. This is known as an iterative process and each step is an iteration.
The most common application for iteration is to create, check, or modify a collection of variables.
In the previous workshop, we were introduced to the idea of conditionals. We saw that an if statement can be used to branch code, but this is only performed once.
If we want to perform a conditional operation repeatedly, we need to use a different statement – the while loop.
The example below will draw six circles onto the canvas. Note that the circles are identical, apart from the x coordinate.
function setup() {
  createCanvas(400, 300);
}

function draw() {
  background(128);
  ellipse(50, 225, 20, 20);
  ellipse(100, 225, 20, 20);
  ellipse(150, 225, 20, 20);
  ellipse(200, 225, 20, 20);
  ellipse(250, 225, 20, 20);
  ellipse(300, 225, 20, 20);
  ellipse(350, 225, 20, 20);
}
We can simplify this code by using a while loop.
function setup() {
  createCanvas(400, 300);
}

function draw() {
  background(128);
  var x = 50;
  while (x <= 350) {
    ellipse(x, 225, 20, 20);
    x = x + 50;
  }
}
What's happening in the above example line-by-line:
-
var x = 50;
Here we create a temporary variable to help us iterate. In this case an integer, initially set to 50. -
while (x <= 350) {
This starts the while loop. As long as the condition inside the parentheses remains true, the code that follows the curly brace will be repeatedly executed (forever!) -
ellipse(x, 225, 20, 20);
We draw a circle. The y-position, height, and width are identical for each; the x-positon is set using the current value of our temporary variable. -
x = x + 50;
The value of the temporary variable is increased by 50.
As soon as the condition inside the parentheses returns false, the while loop exits and code execution continues.
Although this is a very common code pattern, it's unusual to see while loops actually used in code. This is because most programming languages provide us with a more useful variant – the for loop.
A for loop is written slightly differently from a while loop. The parentheses contain three statements separated by semicolons, rather than a simple test.
function setup() {
  createCanvas(400, 300);
}

function draw() {
  background(128);
  for (var x = 50; x <= 350; x = x + 50) {
    ellipse(x, 225, 20, 20);
  }
}
What's happening inside the parentheses:
-
for (var x = 50; x <= 350; x = x + 50) {
A temporary variable is declared and initialised in the first statement. -
for (var x = 50;x <= 350; x = x + 50) {
The second statement contains the condition that is checked. If this returns false the loop exits. -
for (var x = 50; x <= 350;x = x + 50) {
The final statement contains code that is to be executed after each successful loop.
Even in these basic examples, it's clear to see that loops help us avoid repetition and reduce the number of lines of code we write.
Exercise
- Add the
12_iteration_02/directory to Atom - Open
index.htmlin a browser - Change the RGBA values of the pixels inside the nested for loop
- Try using the
random()function to set the colour values - Try using the
xandyvariables to set the colour values
JavaScript Arrays
Arrays are essentially ordered lists of things and each item in that list can be accessed individually. The array itself is a type of variable and it stores other variables inside. The stored variables can be used in the same way as you use any other variable.
Here is a simple array:
var sizes = [ 20, 350, 80, 210 ];
What's important about an array is the order of the items within. To access any individual item of data stored inside the variable, we need to reference the item's position, commonly referred to as the array index. Crucially, the index of an array starts at zero:
console.log(sizes[0]); // logs: 20
And therefore the index of the last item in the array would be one less than total number of items. In our example above we have 4 items, so the final item is accessed using the index 3:
console.log(sizes[3]); // logs: 210
JavaScript arrays are particularly useful since you can store any type of data inside, including integers, strings, objects and—perhaps confusingly—other arrays. Here is an example of an array containing a list of strings:
var technicians = [ "Delia", "Will", "Adam", "Gareth", "Tom" ];
And, as above, we can access the strings using the array variable technicians and counting along the list starting from zero:
console.log( technicians[0] ); // "Delia"
console.log( technicians[2] ); // "Adam"
console.log( technicians[4] ); // "Tom"
Try this for yourself using this CodePen.
Loops and arrays
The code to support this section is located in the following directory and is available to view on Github:
/13_loops_and_arrays/
When we have only a few items in our arrays, it is not a lot of additional code to access each of them explicitly using their index:
ellipse(x, y, sizes[0]);
ellipse(x, y, sizes[1]);
ellipse(x, y, sizes[2]);
ellipse(x, y, sizes[3]);
But even this is repeating code unnecessarily. And when we start to hold hundreds or thousands of items in our array, it would become unmanageable to write out the code above.
To unleash the full potential of arrays, they can be combined with looping structures such as for loops. As we have seen already, the for loop can be used to run a piece of code a number of times, incrementing an index variable on each execution:
for( var i = 0; i < 4; i++ ){
  console.log( i );
}
A further useful feature of arrays is that they have an internal property that contains the current length of the array:
var sizes = [ 20, 350, 80, 210 ];
console.log(sizes.length);        // logs 4
The length property can be used within our for loop to determine how many times the loop runs the code before stopping. In the case of our sizes array above, the loop would continue to execute as long as the i variable is less than (<) the number of items in the array.
This is a very common design pattern.
for( var i = 0; i < sizes.length; i++ ){
  console.log( i );
}
What is happening here?
- The variable
iis set as 0 - The statement
i < sizes.lengthis tested - If the condition is true the code inside runs
- ...and the variable
iis increased by 1 - Go back to point 2 and repeat until false
The code would run 4 times and log 0, 1, 2 and 3.
Now we have a loop that runs as many times as there are items in the array. Crucially, inside that loop, the variable i is incremented by 1. Each time it increments by 1 we can use it to access the value in the array at that index:
for( var i = 0; i < sizes.length; i++ ){
  console.log( sizes[i] );
}
If we recall that the first item in an array uses the index zero, we can see why our i variable is initialised as 0 rather than 1.
Within our for loop we are now running code that accesses each of the items in the array in the correct order.
See this code executed in CodePen.
JavaScript Objects
In JavaScript most things you encounter are actually objects. The strings, arrays and even functions are objects at the most basic level. This is because they can all contain properties and functions inside them.
Here, for example, the variable message has a property called length that returns the length of the string:
var message1 = "what is an object";
console.log(message1.length); // 15
These are objects within internal properties and functions that are provided by the JavaScript engine inside the browser. We do not need write the code for these objects as it already exists.
However, creating your own objects is a very handy way to encapsulate related functions and variables, and also act as data containers. We can also use this technique to model things in a more helpful way.
Let take a look at the variables needed to draw a circle and then how we would move those variables inside an object. Here we define three variables:
var x = 50;
var y = 100;
var size = 20;
ellipse( x, y, size );
And here are the same three variables inside an object:
var circle = {
  x    : 50,
  y    : 100,
  size : 20
};
The first thing to note is that the object starts and ends with curly braces; the same way that we start and end functions and if statements.
Pay careful attention to the differences between declaring variables inside and outside of an object. Variables stored inside objects are called properties and each property has a value. The major difference in syntax is that properties and values are separated by a colon (:) instead of an equals sign (=).
x : 50, // Note the colon ':' separator...
And each of the property/value pairs are separated by a comma (,), not a semi-colon (;). The exception to this is rule is the last pair for which the comma is optional
x    : 50,  // ...and each pair separated by a comma
y    : 100,
size : 20   // except the last, which is optional
So now that the data that defines our circle is contained within an object how do we access that data? To access a property of an object the dot syntax is used. For example to access the x value:
circle.x
So to rewrite our code above using an object:
var circle = {
  x    : 50,
  y    : 100,
  size : 20
};

ellipse( circle.x, circle.y, circle.size );
See a simple example of this on CodePen.
A more advanced use of objects is to create templates of things that we want to represent in our code. These templates or models can be used to create different permutations of the same type. This is called abstraction and is one of the fundamentals of object-oriented programming (OOP). Mozilla Developer Network has a very good section about objects and a really interesting page introducing OOP and how to implement it using JavaScript objects.
Here is an example on CodePen of the above circle sketch created using a constructor function. This is a simple example of using Object Oriented Programming in JavaScript.
Pixel array
The code to support this section is located in the following directory and is available to view on Github:
/14_pixel_array/
Previously we have discussed that our p5.js canvas is made up of individual pixels. Each of them can be located using an X coordinate between 0 and the width and a Y value between 0 and the height. Also known as Cartesian coordinates.
So how many pixels are there in a canvas of 600 pixels in width and 500 pixels in height:
600 x 500 = 300000 pixels
We have also discussed that each pixel is made up of three values: red, green and blue. Well, there is actually a fourth value, which we haven't discussed in a great detail called alpha. This sets the transparency value of the pixel. So for every pixel on the p5.js/HTML canvas there are 4 pieces of information:
red, green, blue, alpha
So in total for our canvas of 600 x 500 we have this many pieces of information:
300000 (pixels) x 4 (colour value) = 1200000
![]()
All of this information is stored in one large linear array, which we can easily access and manipulate. However arrays are simply lists so they do not have a concept of which index relates to which X and Y coordinate on our screen.
![]()
If we want to access a particular pixel we do not refer to it as, for example, the 29th pixel (the last pixel in our example above). We are more likely to reference it using the X and Y coordinates. So how do we get from an X and Y coordinate to access and manipulate the 4 colour values within the pixel array?
![]()
In the image above the red dot represents a pixel on screen that we want to target in the pixel array to access or change the 4 colour values.
If we were to count the grey boxes you can see that before we reach the red dot we have 2 full rows, which equates to (y * width). Then we count in (or add) x positions. The formula to calculate this for any x and y value is therefore:
x + (y * width)
So far so good. However now we know that the number of the pixel in the canvas but for every pixel there are 4 values in the array. Therefore to calculate the first of four positions in the array that contains the RGBA values for our pixel we simply multiple by 4. In our above example we have calculated the pixel position to be the 16th:
16 (pixel position) * 4 (colour values) = 64 (array index)
![]()
So now we know that the four positions in the array that represent our pixel are 64, 65, 66 and 67. We can therefore write the following code to manually set the colour of that pixel:
function draw() {
  loadPixels();


  pixels[64] = 255;    // red
  pixels[65] = 255;    // green
  pixels[66] = 255;    // blue
  pixels[67] = 255;    // alpha

  updatePixels();
}
But that is not very reusable code and we would have to manually calculate the index again every time we wanted to address a new pixel. What would be much better is to put all of those calculations into variables so we can simply change the X & Y value with ease:
function draw() {
  loadPixels();

  var x = 40;
  var y = 20;
  var index = ( x + (y * width) ) * 4;

  pixels[index] = 255;      // red
  pixels[index+1] = 255;    // green
  pixels[index+2] = 255;    // blue
  pixels[index+3] = 255;    // alpha

  updatePixels();
}
Using the above code we can address a particular pixel and then access the colours within the pixel array.
Try changing the X and Y values on this CodePen. You may need to look closely or zoom in to see the single coloured pixel.
So we now can access individual pixels based on their X & Y coordinates, what if we wanted to modify all the pixels. We can do this by using a nested for loop to iterate along every pixel on the X and Y axis. A nested for loop is one loop within another:
// Loop through every pixel on the X axis...
for ( var x = 0; x < width; x++ ) {
  // ...and for each X, loop through every pixels on the Y axis
  for ( var y = 0; y < height; y++ ) {
     // Every (x, y) coordinate is looped here:
     var index = (x + y * width) * 4;
     pixels[index] = 255;     // red
     pixels[index+1] = 0;     // green
     pixels[index+2] = 0;     // blue
     pixels[index+3] = 255;   // alpha
  }
}
In this example above every pixel is set to full red, no green, no blue and full transparency.
Exercise
- Add the
12_pixel_arraydirectory to Atom - Open
index.htmlin a browser - Change the RGBA values of the pixels inside the nested for loop
- Try using the
random()function to set the colour values - Try using the
xandyvariables to set the colour values
Image pixel data
The code to support this section is located in the following directory and is available to view on Github:
/15_image_pixel_array/
p5.js cannot access the image pixel data from an image that is loaded directly from the file system. Therefore you will need to install and run a HTTP server in order to complete the next exercise. To set up an local web server follow these instructions.
So far we have been manipulating the pixel colour values of an empty canvas; or more precisely a canvas full of a single colour. The exact same process is possible but instead of manipulating an empty canvas we can manipulate image data loaded in from an external file.
The data that represents an image is also made up of individual pixels (this is called a raster graphic and therefore within p5.js we access the image pixel data in the exact same way as we have already been accessing pixels in an array. Here is an example of this using a loaded image:
var img;

function preload() {
  img = loadImage("images/maxernst.jpg");
}

function mouseDragged(){
  var index = (mouseX + mouseY * width)*4;

  img.loadPixels();
  var r = img.pixels[index];
  var g = img.pixels[index+1];
  var b = img.pixels[index+2];
  var a = img.pixels[index+3];

  fill(r, g, b, a);
  ellipse(mouseX, mouseY, 40, 40);
}
You will notice a new function being used called preload(). This is a handy function provided by p5.js that ensures that images or external data such as API data are finished loading before calling the setup() and draw() functions:

Inside the preload function we give a relative path as an argument to the loadImage() function. The results of this are stored in a global variable img.
var img;

function preload() {
  img = loadImage("images/maxernst.jpg");
}
Then later in our draw() function we can access the pixel array as a property of the img object. We do this using the dot syntax. Here I am setting the first pixels colour to green:
img.pixel[0] = 0;
img.pixel[1] = 255;
img.pixel[2] = 0;
Exercise
- Add the
13_pixel_arraydirectory to Atom - Set up a local web server and run it within the
13_pixel_arraydirectory. - Open the URL provided by the local web server in a browser.
- Click and drag the mouse around the canvas to see the pixel colours being rendered in circles
- Uncomment the lines in the nested
forloop and play with the rgba values:
img.pixels[index] = r;
img.pixels[index+1] = g;
img.pixels[index+2] = b;
img.pixels[index+3] = a;
Webcam capturing
The code to support this section is located in the following directory and is available to view on Github:
/16_webcam_capture/
This is another instance when you won't be able to run this sketch directly from your filesystem, you will need a local web server running. To set up an local web server follow these instructions.
Using p5.js accessing the webcam is quite straightforward. It takes just a few lines of code:
var capture;

function setup() {
  createCanvas(400, 300);
  pixelDensity(1);

  // Create video capture object.
  capture = createCapture(VIDEO);
  capture.size(width, height);
}

function draw() {
  clear();
  // Draw capture to the canvas.
  image(capture, 0, 0, width, height);
}
Behind the scenes the createCapture() function does a few clever things. Firstly it causes the browser to ask the user if they want their camera to be opened and used. This is a security provision to ensure nefarious programmers cannot access webcams without permission. Secondly it creates a HTML Video element in the browser and places it next to our p5.js canvas. We can then use the image data from inside that HTML Video object to draw into our canvas.
See this in action on CodePen.
However this leaves us with two copies of the webcam video. That is why we call capture.hide() in all the following examples.
What is extremely useful about this object stored in the capture variable is that the pixels inside it can be treated exactly the same as the pixel array and image pixel array examples.
clear();
capture.loadPixels();
for ( var x = 0; x < width; x++ ) {
  for ( var y = 0; y < height; y++ ) {
    // Get the pixel at x and y position
    var index = (x + y * width) * 4;
    capture.pixels[index] = 255;     // red
    // capture.pixels[index+1] = 0;   // green
    // capture.pixels[index+2] = 0;   // blue
    // capture.pixels[index+3] = 0;   // alpha
  }
}
capture.updatePixels();
image(capture, 0, 0, width, height);
In this example above every pixels has had it's red value cranked up to maximum giving the captured image a distinctly red tint.
Within the exercise code you will also find a call to the saveCanvas() function being used within the keyPressed() function:
function keyPressed(){
  if (keyCode == RETURN) {
    saveCanvas("webcam", "jpg");
  }
}
This 4 lines of code allows the webcam image to be saved and downloaded as a JPG when the return key is pressed.
Exercise
- Add the
16_webcam_capturedirectory to Atom - Set up a local web server and run it within the
16_webcam_capturedirectory. - Open the URL provided by the local web server in a browser.
- Hit the enter key to download a frame of the webcam video
- Uncomment the lines in the nested
forloop and play with the rgba values:
capture.pixels[index] = 255;     // red
capture.pixels[index+1] = 255;   // green
capture.pixels[index+2] = 255;   // blue
capture.pixels[index+3] = 255;   // alpha
Week 4 - Other inputs and APIs
Outcomes
- Independently researching new features of p5.js using the documentation
- Using inputs to control behaviour of your sketch
- Understanding the concept of web-based APIs and basic use
- In groups create a sketch that uses either at least one input (learnt today) or APIs to create an interactive sketch
Local web server
So far during this series of workshops testing your code has involved opening the index.html file in your browser, which results in an absolute file path in the browser address bar (see below). You can see this indicated by the file:// protocol followed by the absolute file path to the index.html file:
For some examples you will need to run a local HTTP web server that serves the files in a project. If you have Node.js already installed you can run the following command to install an HTTP web server:
sudo npm install -g http-server
If you receive an error from the above command it's likely that you do not have Node.js installed. In which case visit the Node.js homepage and download/install the LTS version and repeat the command above.
Once you have installed the HTTP web server you will need to change directory (cd) into the project directory on the command line and run the server:
cd ~/Desktop/intro-to-programming-2017/15_image_pixel_array/
http-server
If successful you will see messages in the command line similar to this:
You can then copy and paste one of the URLs into you browser:
Other Inputs
So far you have used the input for mouse position to affect the visual output in your sketch.
There are a range of other inputs we can use to create dynamic / interactive sketches:
- Click
- Keyboard
- Touch / Drag
- Rotation
Experiment with these other inputs using the p5.js reference. Search for ‘Events’ section in the reference.
APIs
The code to support this section is located in the following directory and is available to view on Github:
/19_api_playground/
Here are a list of APIs you can use for this example:
APIs
OPEN
- Blockchain (Documentation):
https://blockchain.info/latestblock
- Most Recent Earthquakes:
http://apis.is/earthquake/is
- Icelandic Open Data (Documentation):
- MusicBrainz:
http://musicbrainz.org/ws/2/artist/5b11f4ce-a62d-471e-81fc-a69a8278c7da?inc=aliases&fmt=json
- Exchange Rates (Documentation):
https://api.fixer.io/latest?symbols=USD,GBP
REQUIRES API KEY
-
Weather (Documentation):
http://api.apixu.com/v1/current.json?key=YOUR_API_KEY_HERE&q=London -
Population Statistics (Documentation):
http://inqstatsapi.inqubu.com/?api_key=YOUR_API_KEY_HERE&countries=us&data=population&years=1980:1990 -
NASA Near Eath Objects (Documentation):
https://api.nasa.gov/neo/rest/v1/feed?start_date=2016-12-24&end_date=2016-12-25&api_key=YOUR_API_KEY_HERE
Other workshops
Creative Coding 101
The slides for Introduction to Creative Coding are attached as a file on the left of this page!
Concepts
A collection of resources which outline ways of thinking in creative computation, computer science, and associated areas.
Planning
Fundamentals
Variables: Declaration, Assignment, Reassignment
Typing: Strings, Integers/Floats, Boolean
Arithmetic - + * /
Conditional Logic / Control flow
-
ifelseelseif - boolean conditions and comparison operators
== - logical operators
&&||
Iteration
-
forwhile - arrays
Functions
Other concepts
Coordinates (Cartesian/Polar)
Colour space / Additive Colour / RGBA / HSB
Pseudocode / Debugging / Logging
Data structures - JSON / XML / CSV
Objects
Pseudoclassical and other patterns (e.g. IIFE)
https://addyosmani.com/resources/essentialjsdesignpatterns/book/
Ternary statements
Development environment - Atom + plugins/extensions
Math functions - random, sine
map()
P5JS
pixel arrays
stroke, fill, other functions
library globals
Systems in art & design
Paul Rand
 |
 |
|---|
Another kind of definition is that design is a system of relationships between all of the aspects of the problem, which means the relationship between you and the piece of canvas, you and the eraser, you and the pen. The relationship between the elements proportions, which mean the relationship of sizes. I can go on all day. Paul Rand
Bauhaus
 |
 |
|---|
 Joseph Albers |
 Joseph Albers |
|---|
Swiss Style
 |
 |
|---|
Linear Perspective
15th century experiments in Linear Perspective.
 |
.jpg) |
 |
|---|
Sol Lewitt - Instructions for making art
In conceptual art the idea or concept is the most important aspect of the work. When an artist uses a conceptual form of art, it means that all of the planning and decisions are made beforehand and the execution is a perfunctory affair. The idea becomes a machine that makes the art. Sol LeWitt
 |
 |
|---|
John Cage - Music of Changes and Chance
 |
 |
|---|
Kerry Strand - California Computer Products Inc
 |
 |
|---|
John Albers - The Responsive Eye (1965) & Michael Noll
 |
 |
|---|
an intellectual and active creative partner that, when fully exploited, could be used to produce wholly new forms and possible new aesthetic experiences
Cybernetic Serendipity - Institute of Contemporary Art (1968)
 |
|---|
 Gordon Pasque - Colloquy of Mobiles |
|---|
Exemplary for the appeal of the great promises made early in the computer age, Cybernetic Serendipity epitomizes the dilemma much of media art faces today: its complicated relationship with the socio-economic environment, the difficulty of engaging with its own historicity and transcending mere techno-fetishism, and the all-too-familiar sense of a naïve, unbridled optimism with its inevitable pitfalls and false dawns. link
The utilization of scientific know-how, however, did not simply lead to a re-valorization of the art object and the materials that could be made of it. On the contrary, the integration of technology engendered a growing interest that went beyond a strictly object-oriented approach toward practices that focus on process, ideas and (inter-) actions. Concomitant with experiments in participation and interaction, with happenings, performances, land art and conceptual art, media art is often regarded as a conclusion of the de-materialization of the art object. link
Digital Culture by Charlie Gere
Section on Art and Cybernetics from 1950s in Europe and the US.
Project Cybersyn
 |
|---|
Jack Burnham - System Esthetics
 |
|---|
Art that is transactional in that they deal with underlying structures of communication and energy exchange
- http://www.tate.org.uk/research/publications/tate-papers/05/all-systems-go-recovering-jack-burnhams-systems-aesthetics
- https://monoskop.org/images/0/03/Burnham_Jack_1968_Systems_Esthetics_Artforum.pdf
- http://www.tate.org.uk/whats-on/tate-modern/exhibition/open-systems
3D Geometry and Parametric Design
This is an informal workshop experimenting with a method of generating 3D meshes from 2D images based on the RGB colour space and making this content viewable in low-fi VR headsets.
I have been making a piece of software using openFrameworks to explore creating generative 3D meshes and also the challenge of quickly and easily getting 3D models into a lo-fi VR environment. During the workshop I will introduce you to the some basic concepts of 3D modelling and explain how this software can be used as a tool to explain generative design. Below is a screenshot of the software:
Aims
- Achieve a basic understanding of concepts in 3D geometry
- Become familiar with the concept of parametric design
- Generate 3D meshes from found and created 2D images
- Import 3D meshes into SketchFab, an online platform for sharing and discovering 3D models.
Pre-requisites
- Download Google Cardboard app for iPhone or Android
- Access to a computer
Concepts in 3D geometry
We will examine some of the fundamental principles of 3D geometry that allow the computational representation of three dimensional shapes and allow us to understand how these can be created programatically.

Glossary of Terms
-
Vertex (singular) or Vertices (plural)
One or more points in 3D space. -
Cartesian Coordinates
A vertex is commonly located in 3D space using the Cartesian coordinate system. When positioning a point on you use the the X, Y and Z coordinates as show below:

-
Primitives
When joined together vertices make the basic building blocks of a 3D structure. The shapes formed are called primitives. Primitives can be points and lines but they become more useful when they form more complex shapes such as triangles or rectangles that can form a surface area. also known as a face. -
Face
As you can see from the the cow model each of the individual triangles is covered by a flat surface. Each one of these is a face, which combined make up the surface of the solid object. -
Triangles
To create a face you must have 3 or more vertices. This is why the triangle is the commonly used shape in 3D modelling. It is the most simple (or primitive) shape and can be used to represent the surface of a model. -
Tesselation
Tesselation is the process of filing a flat surface with shapes (or tiles) so that there are no gaps in that surface.
 |
 |
 |
|---|
 |
 |
|---|
Graphics cards on computers work only work with triangles so any 3D shape you see on screen will have been converted in triangles at some point by the software or by the graphics card itself.

Parametric Design
The ground of parametric design is the generation of geometry from the definition of a family of initial parameters and the design of the formal relations they keep with each other.
What is a parameter?
In maths it is the part of an equation that can be variable, creating change in the output/result. It follows this simple model:
| INPUT (PARAMETER) | > | EQUATION | > | OUTPUT |
|---|
In programming and computation writing an algorithm follows this pattern. When an input parameter is changed the rules of the equation or algorithm produce a variety of possible outcomes. If there are multiple input parameters then those possible outcomes increase exponentially.
Algorithms as a design partner
The project below is a study of algorithms on baroque and renaissance paintings. The artist, David Quayola, leaves behind the iconographic meaning of the pictures and uses the raw information (for example colour, shape and the relationships within these) to create new pieces. The informational nature of the pictures can be used in combination with algorithms to modify outputs. No doubt within the creative process there are ways to manually delve into the code to tweak parameters and therefore manipulate the possible outcomes.
 |
 |
|---|
Parametric design is also used within architecture to functionally and creatively explore the possibilities in 3D spatial design. Combining formal rules (i.e. algorithms or equations) and making small variations to the input can produce huge and sometimes unexpected shifts in outcome.

As you can see from this Google search for parametric design (June, 2017) there is a recognisable style that is reminiscent of organic shapes and patterns. Without speculating on the functional or aesthetic value of this trajectory it is without doubt a function of designing with the aid of powerful computers that can model physical systems in nature that has enabled this. The relationship between parametric design and this type of outcome is that each of these designs would be partially determined by systems of rules in computation and part by the agency of designers, architects or artists.

Characteristics of Parametric Design
-
Creating Composition Systems
As a designer you often construct systems or 'grammars' that help to guide an outcome. This is the principle of parametric design however formalised into code and software. -
Variation
Variation to a single parameter of a system (i.e. equation or algorithm) can create change in the output that is proportionally larger to the scale of the input. Increasing the number of parameters can again increase the variations of output exponentially! The challenge then becomes how to capture these outputs and make choices between them. -
Complexity
Simple rules create complex outcomes. Also incorporating randomness into systems can increase the the variation of outcomes. -
Modelling physical systems
The speed of calculations in modern computers means that simulation or modelling of physical systems is entirely possible and in doing so can become part of system of parametric design.
The Software
How does the software work? Let's use it and find out.


If you want to recreate or learn from this yourself the code is available here and I would recommend following this tutorial for a grounding in 3D meshes in openFrameworks.
Further Reading / Watching:
- Parametric Design Fundamentals YouTube series
- A History of Parametric Design
- What is Parametric Design?
- openFrameworks Book: Generating Meshes from 2D images (This was an invaluable resource used for the creation of the software in this workshop)